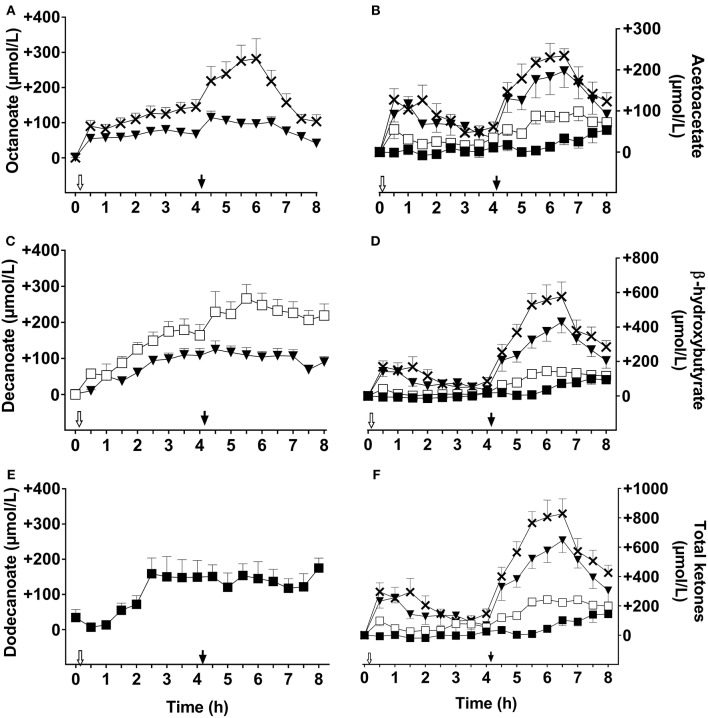
Figure 1.
Plasma octanoate (A), acetoacetate (B), decanoate (C), β-hydroxybutyrate (D), dodecanoate (E), and total ketones (F) throughout the 8 h metabolic study day during which two 20 ml doses of the following test substances were consumed: tricaprylin (C8,×), tricaprin(C10,□), medium chain triglyceride (C8C10, ▾), or trilaurin (C12, ■). Plasma acetoacetate, β-hydroxybutyrate, and total ketones values were normalized to T0, and control day values were subtracted prior to graphing the results. Plasma octanoate, decanoate, and dodecanoate were extracted from plasma total lipids. The white arrow ( ) indicates the time at which breakfast plus the dose of test oil was consumed; the black arrow (
 ) indicates when the dose of test oil alone was consumed at midday (without a meal). Data are the mean ± SEM for n = 8–9 participants/point.

