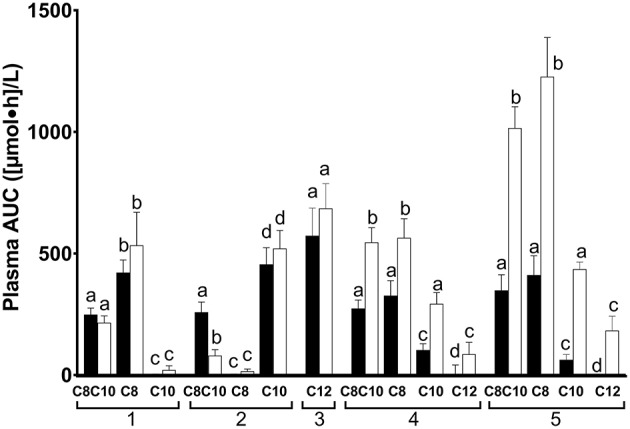
Figure 2.

Area-under-the-curve (AUC) of plasma octanoate (1), decanoate (2), dodecanoate (3), acetoacetate (4), and β-hydroxybutyrate (5) during the metabolic study day on which the doses of medium chain triglyceride (C8C10), tricaprylin (C8), tricaprin (C10), or trilaurin (C12) were tested. Plasma MCFA were extracted from total plasma lipids. AUC data are shown in pairs of bars: the left-hand bar of each pair represents the data for the 0–4 h AUC while the right-hand bar represents the 4–8 h AUC. Bars are the mean ± SEM for n = 8–9. For each metabolite shown, the 0–4 h AUC was significantly different from the 4–8 h AUC where letters are different (P < 0.05).
