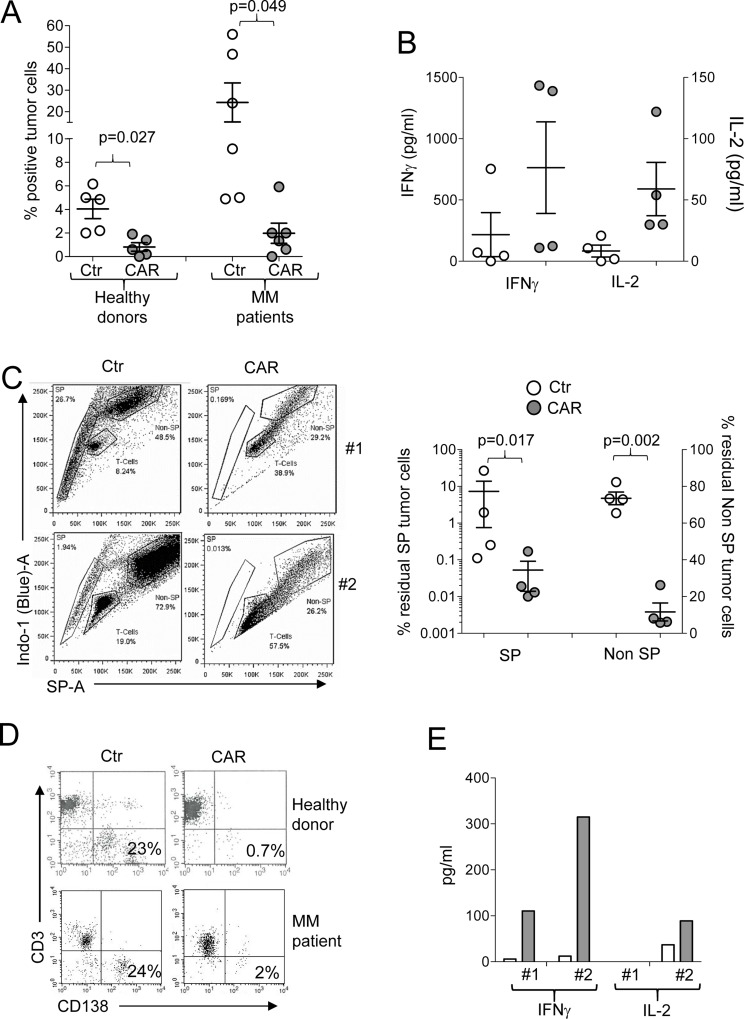
Figure 5. Targeting of primary MM tumors.
(A) shows the percentage of residual MM tumor cells in experiments in which primary MM cells were co-cultured with autologous (MM patients derived) or allogeneic (healthy donor derived) Ctr-Ts and CD138.CAR-Ts. T cells and malignant plasma cells were quantified by flow cytometry. Each symbol represents a donor and the lines represent the mean and SEM for the groups. Shown are the p values using a two-way paired t-test. (B) shows the quantification of IFNγ, and IL-2 released in the supernatant by Ctr-Ts or CD138.CAR-Ts generated from MM patients co-cultured for 24 hrs with autologous malignant plasma cells, and quantified by CBA assays. (C) shows the flow plots for two representative donors of Ctr-Ts or CD138.CAR-Ts co-cultured with CD138+ RPMI MM cell line. SP cells, non-SP cells and T cells at the end of the 3 days co-culture are shown. The graph on the right panel summaries the residual SP cells and non-SP cells in co-culture with CD138.CAR-Ts obtained from healthy donors (n = 2) and MM patients (n = 2). Shown are p value of two-way paired t-test. (D) shows the flow plots for two representative donors of Ctr-Ts or CD138.CAR-Ts co-cultured with SP cells sorted from the RPMI MM cell line. (E) shows the quantification of IFNγ and IL-2 released in the supernatant of Ctr-Ts or CD138.CAR-Ts from 2 representative donors co-cultured with sorted SP cells, and quantified by CBA-assay.

