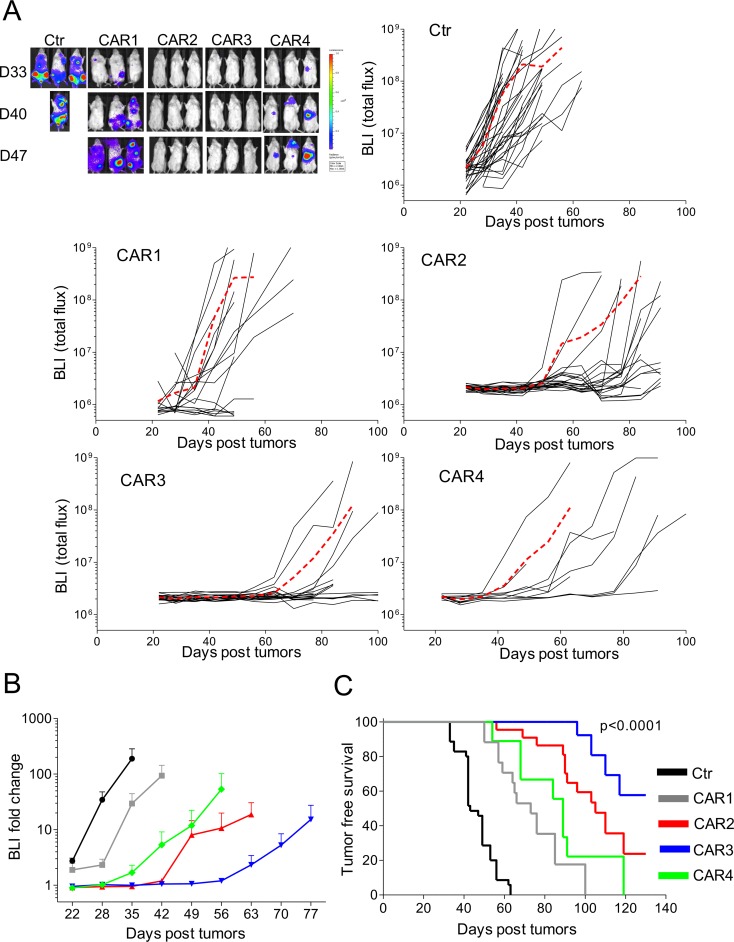
Figure 6. In vivo antitumor activity of CD138.CAR-Ts.
NSG mice were engrafted with CD138+ OPM-2 cell line labeled with firefly (FF)-luciferase (4 × 10⁶), and treated 2 weeks later with Ctr-Ts or CD138.CAR-Ts (1 × 10⁷). (A) shows the bioluminescence signals (BLI) of Ctr-Ts and CD138.CAR-Ts. Each line shows the BLI for each mouse and the red dashed line the average of the BLI intensity for each group. (B) shows the fold expansion of BLI as compared to day 14 (day of T cell injection) summarized as average (± SEM). (C) shows the Kaplan-Meier survival curve [Ctr-Ts = 34 mice (T cells from a total of 7 donors); CAR1 = 17 mice (3 donors); CAR2 = 22 mice (5 donors); CAR3=18 mice (4 donors); CAR4 = 10 mice (2 donors)].

