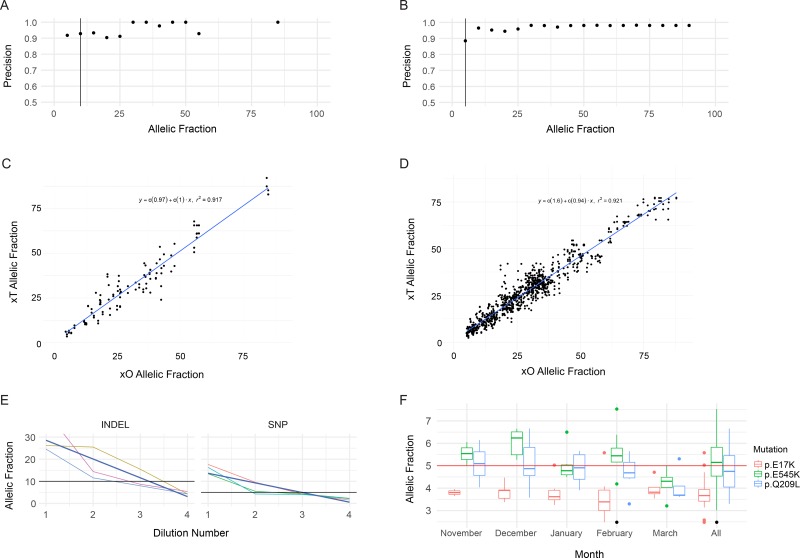
Figure 1. Performance of SNV and Indel Detection by the Tempus xT assay.
(A) Precision of indel detection by VAF. Precision was calculated for each bin of variants with allele fractions rounded to the nearest 5 percent. The vertical black line corresponds to the LOD. (B) Precision of SNV detection by VAF, as in A. (C) Correlation of xT assay indel VAFs to xO assay indel VAFs. (D) Correlation of xT assay SNV VAFs to xO assay SNV VAFs. (E) VAFs of indels and SNVs detected on chromosome 17 in four samples with serial 1:1 dilutions of the xT assay. Dark blue lines indicate best fit of a linear model. (F) Positive control detection. Boxplots of the VAF of three SNVs in a positive control sample run on every xT assay over a period of 5 months. The single point marked in black is an AKT1 p.E17K variant which failed filtering criteria.

