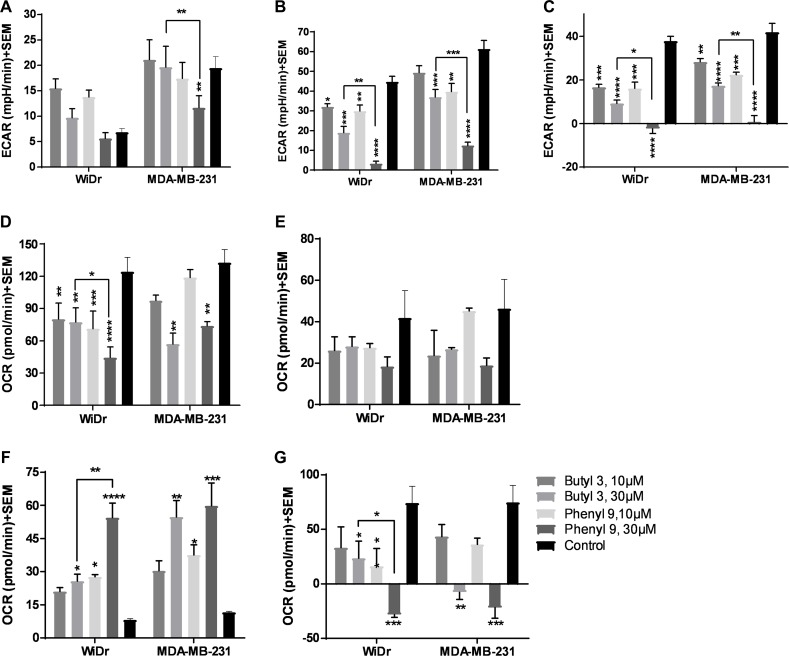
Figure 3. Glycolysis and mitochondrial stress tests of compounds 3 and 9.
(A–C) represent the parameters from glycolysis stress test: (A) glycolysis, (B) glycolytic capacity, and (C) glycolytic reserve of compounds at 30 μM concentration in WiDr and MDA-MB-231 cells. (D–G) represent the parameters from mitochondrial stress test: (D) maximal respiration, (E) ATP production, (F) proton leak, and (G) spare respiratory capacity in WiDr and MDA-MB-231 cells. The ECAR and OCR values of were calculated using wave software. The average + SEM values of at least three independent experimental values were calculated. *P < 0.05, **P < 0.01, ***P < 0.001, ****P < 0.0001.

