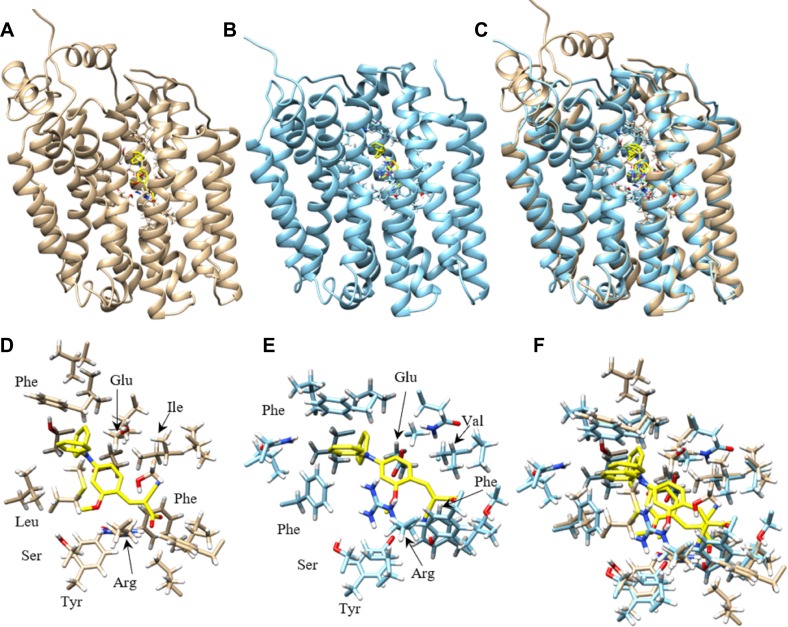
Figure 5. Homology model of human MCT1 and MCT4 docked with compound 9.
Most favorable compound 9 binding pose to human MCT1 and MCT4 were represented. (A) Cα ribbon homology structure of MCT1 with docked compound 9 (yellow) and binding site residues within 4.5 Å shown. (B) Cα ribbon homology structure of MCT4 with docked compound 9 (yellow) and binding site residues within 4.5 Å shown. (C) Overlay of MCT1 and MCT4 homology models and their respective best compound 9 docking pose. (D) Compound 9 (yellow) and residue forming its binding site in MCT1, all residues within 4.5 Å are shown. (E) Compound 9 (yellow) and residue forming its binding site in MCT1, all residues within 4.5 Å are shown. (F) Overlay of most favorable binding pose of compound 9 for MCT1 and MCT4 and all residues within 4.5 Å. Models were displayed with Chimera.

