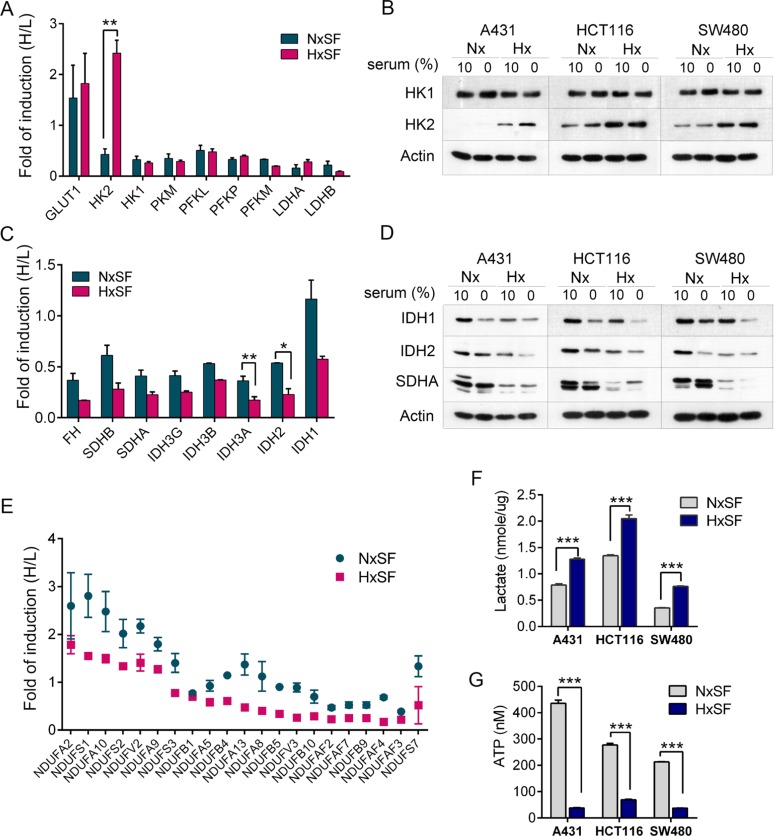
Figure 2. The oxygen and nutrients supplies modulate the expression of key metabolic enzymes in cancer cells.
(A) Protein synthesis ratio of key glycolytic enzymes. Expression of GLUT1 and HK2 was increased in hypoxic A431 cells (HxSF). Induction fold was normalized by pre-existing proteins. Error bars represent the mean±s.d., n=2. **p<0.01. (B) A431, HCT116, or SW480 cells were cultured at the indicated condition for 24 hr and subjected to western blot analysis for HK1 and HK2. Actin was used as loading control. (C) Protein synthesis of key TCA cycle enzymes was suppressed in A431 cells grown in serum-depleted condition. Induction fold was normalized by pre-existing proteins. Error bars represent the mean±s.d., n=2. **p<0.01, *p<0.05. (D) A431, HCT116, or SW480 cells were cultured at the indicated condition for 24 hr and subjected to western blot analysis for key TCA cycle enzymes. Actin was used as loading control. (E) Hypoxia suppressed protein synthesis of mitochondrial complex I NADH dehydrogenase (NADH:ubiquinone oxidoreductase core subunits, NDUFs) in A431 cells. Induction fold was normalized by pre-existing proteins. (F) Three hypoxic cancer cells, A431, HCT116, and SW480, displayed more than a 1.5-2 fold increase in lactate levels compared with normoxic cells. Error bars represent the mean±s.d., n=3. ***p<0.001 (G) Three hypoxic cancer cells, A431, HCT116, and SW480, displayed a significant reduction in intracellular ATP levels compared with normoxic cells. ATP contents (nM) were compared in equal number of cells. Error bars represent the mean ± s.d., n=3. ***p<0.001. Abbreviations: Nx, normoxia; Hx, hypoxia; SF, serum free.

