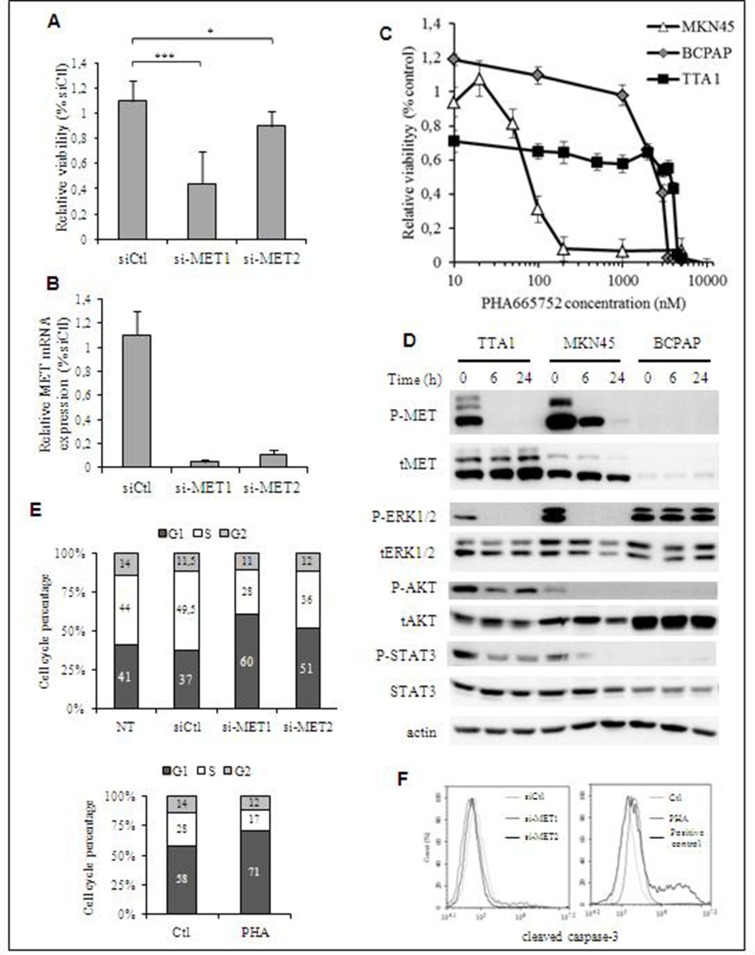
Figure 4. Effect of MET inactivation in TTA1 cells.
(A) TTA1 cells were transfected with two MET siRNA and one control siRNA (siCtl). Cell viability was determined at day 2 by using the crystal violet staining assay. The mean results of 8 replicates in four representative experiments are reported. (B) MET mRNA expression analysis by qRT-PCR in TTA1 cells 2 days after transfection with the siCtl and the 2 MET si-RNA used in cell viability assay (C) TTA1, BCPAP and MKN45 cells were treated with increased doses of PHA665752 over the course of 48 h. Cell viability was analyzed using the MTT assay. The MKN45 gastric cancer cells (with MET amplification) were used as sensitive to PHA665752 (IC50 = 70.8 nM). The BCPAP thyroid cancer cells (without any MET amplification) were used as a model of resistant cell line (IC50 = 2500 nM). (D) Western blot analysis of activated and total MET, ERK1/2, AKT and STAT3 in TTA1, BCPAP and MKN45 cells treated with 200 nM PHA665752 over a period of 6 or 24 hours. (E) Cell cycle analysis after propidium staining of TTA1 cells 2 days after transfection with MET si-RNAs (upper panel; NT: not transfected cells) or treated with 200 nM PHA65752 for 48 hours or not (lower panel). The mean results of two independent experiments are represented. The numbers in columns indicate the percentage of cells in G1, S and G2 cell phase, as indicated. (F) Apoptosis analysis by cleaved caspase-3 staining of si-MET transfected TTA1 cells (left panel) or TTA1 cells treated with 200 nM PHA65752 during 48 hours or not (right panel).

