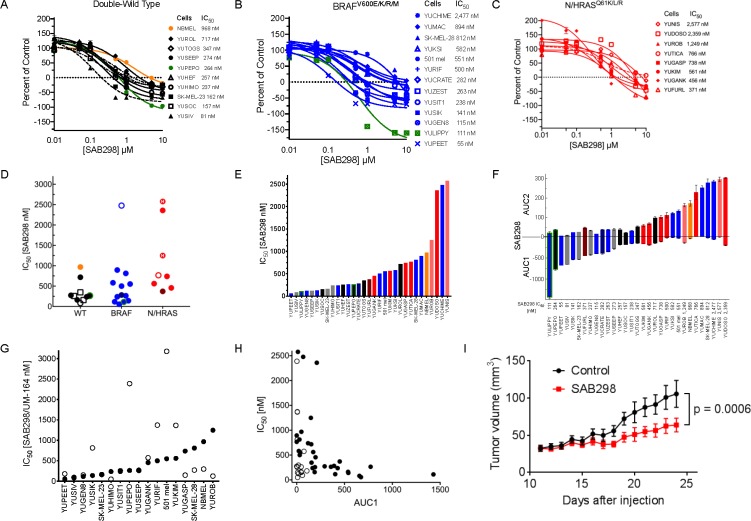
Figure 2. Suppression of cell proliferation in response to SAB298 and UM-164.
The results show CellTiter-Glo® Luminescent Viability Assay and the values are average of triplicate or quadruplet wells, displayed as percent of control assessed at the end of 72 hours treatment ± SE. (A–C) Growth arrest in response to SAB298. The legends on the right provides the IC50, i.e., drug concentrations that reduced cell viability to 50% of the control generated in GraphPad Prism. Black, blue and red lines indicate melanoma cells that are wild-type for BRAF or NRAS (double-wild type), BRAFV600E/K, or NRAS/HRASQ61 mutants, respectively. Green lines indicate ocular melanoma cells with GNA11Q209L, broken lines are NF1null (---), broken dot broken line are RAC1P29S/NF1null double mutant (-.-), and orange line indicates normal human melanocytes that are wild type for all mutations. STDV was about 5% of total count. (D–F) show aligned dot-plot of SAB298 IC50 values, bar graph of increasing levels of IC50 and AUC (Area Under the Curve). Color code as in (A–C). Grey bars indicate melanoma with fusion genes and (H), indicates HRASQ61K mutation. (G and H) show comparisons between SAB298 (●) and UM-164 ○ in IC50, AUC1. (I) Tumor growth in response to SAB298. YUSIK tumor bearing mice were treated daily with intraperitoneal injection of 20 mg/kg SAB298 (red) starting on day 12 after injection or with solvent as control (blue). Data are average of 6 mice ± SEM. The p-value of 0.0006 was calculated by Uncorrected Fisher’s LSD using GraphPad based on the last day data.  NBMEL;
  NF1;
NF1;  NF1 and RAC1;
  GNA11Q209L;
  NRASG12D;
  BRAFG469A.

