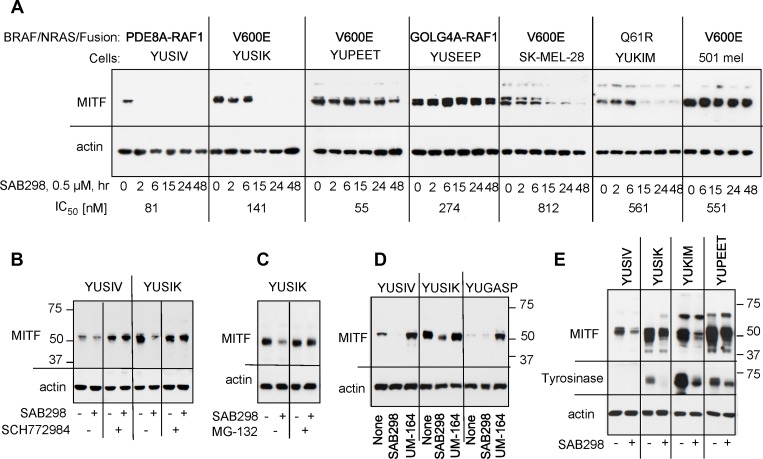
Figure 9. Suppression of MITF in response to SAB298.
(A) MITF levels in melanoma cells incubated for increasing periods of times with SAB298 (0.5 µM). The oncogenic status of each cell line is indicated on the top and the IC50 on the bottom of the panels. (B) The MEK inhibitor SCH772984 (0.5 µM) abolished SAB298 (0.5 µM) induced suppression of MITF. Cells were harvested after 6 hrs treatment with the drugs. (C) The proteasomal inhibitor MG-132 (20 µM, 24 hrs) suppressed MITF degradation in response to SAB298. (D) The SRC inhibitor UM-164 (1 µM, 6 hrs) increases MITF expression. (E) Tyrosinase levels decrease in response to SAB298 (0.5 µM for 20 hrs) due to downregulation of MITF.

