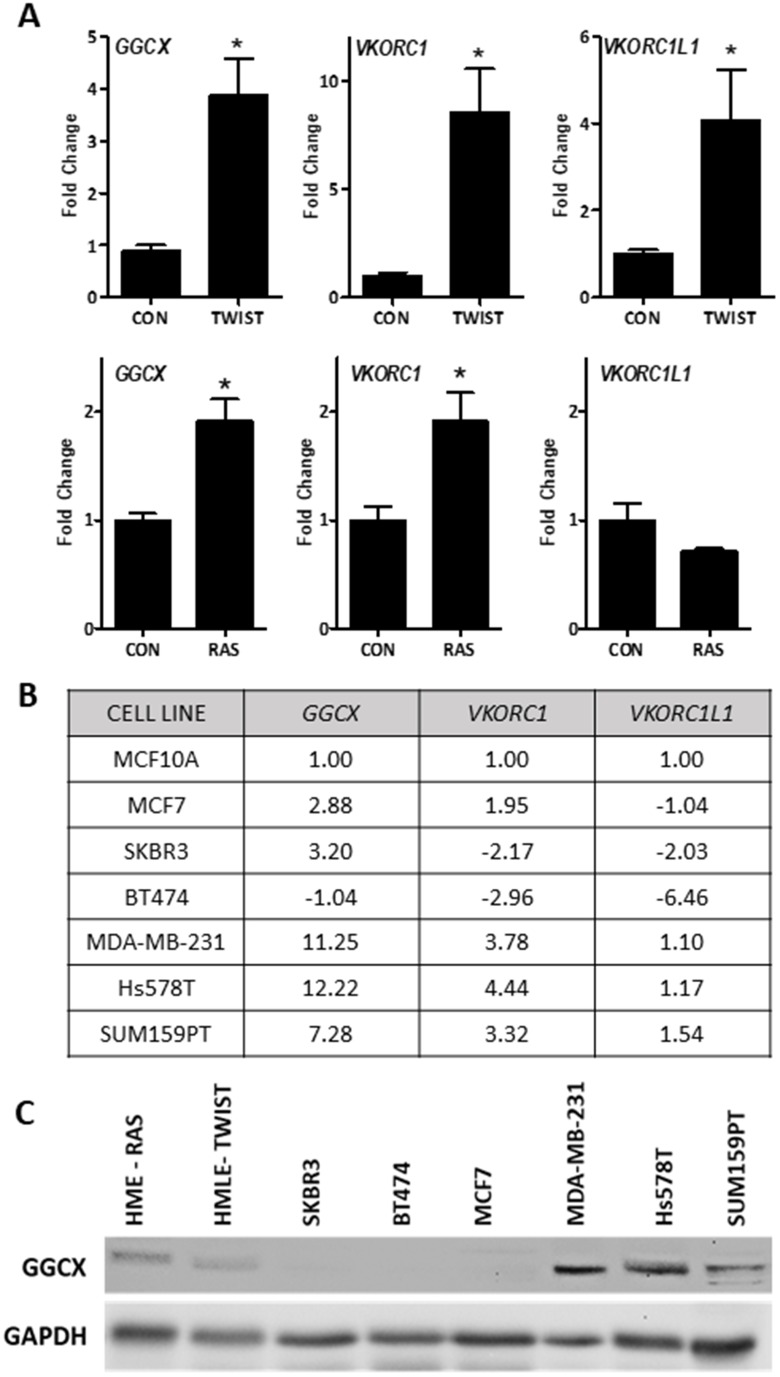
Figure 2. Basal expression of the vitamin K pathway in cellular models of breast cancer.
(A) Expression of GGCX, VKORC1, and VKORC1L1 in mammary epithelial cells expressing TWIST (top) or RAS (bottom). (B) Summary table of gene expression in non-tumorigenic breast cells (MCF10A) and breast cancer cell lines: ER+ (MCF7), HER2+ (SKBR3, BT474), and triple negative (MDA-MB-231, Hs578T, and SUM159PT). For A-B, data was normalized to 18S and expressed relative to control cells (A-HMLE or HME, B-MCF10A) set to 1. Fold-change values represent mean of 3 independent biological replicates run in duplicate. A shows fold change ± SD. *Significantly different compared to control (p < 0.05) as measured by one-way ANOVA and Tukey post-test. (C) Western blot for GGCX and GAPDH loading control in breast cancer cell lines and mammary epithelial cells expressing RAS (HME-RAS) or TWIST (HMLE-TWIST).

