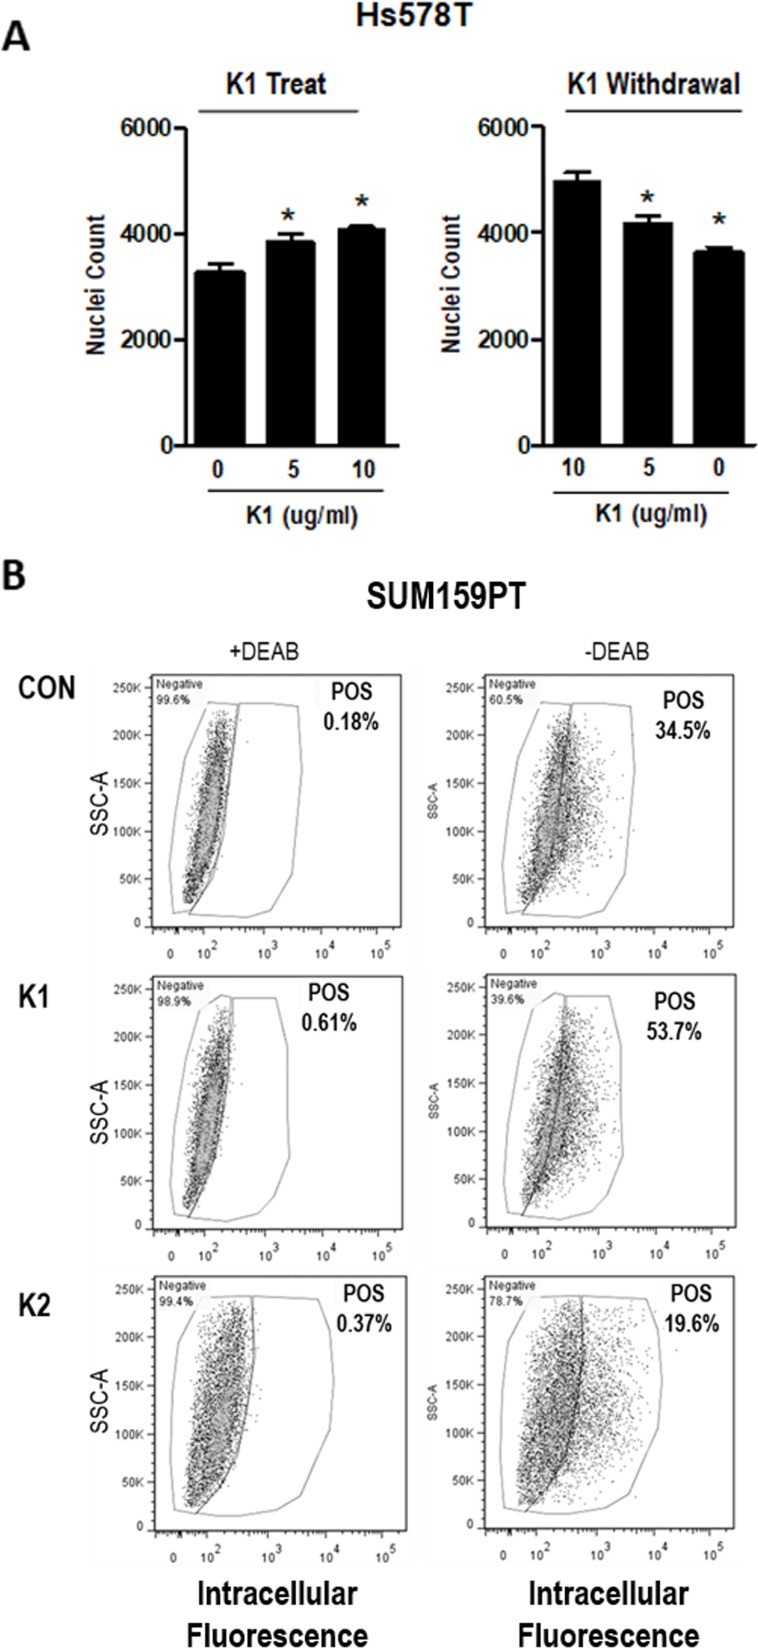
Figure 3. Effect of K vitamins on TNBC cell density and ALDH+ population.
(A) Left, Nuclei counts of Hs578T cells grown in standard media and plated with 0, 5, or 10 μg/ml K1 for 72 h growth assay. (A) Right, Cells were maintained in K1 (5 μg/ml) for > 3 passages and plated with 0, 5, or 10 μg/ml K1 for 72 h growth assay. Data represents mean ± SD of 3 biological replicates run in triplicate. *Significantly different compared to control (p<0.05) as measured by one-way ANOVA and Tukey post-test. (B) SUM159PT cells were maintained in media containing vehicle (CON), 5 μg/ml K1, or 5 μg/ml K2 and assayed with the ALDEFLUOR™ kit (STEMCELL Technologies). Cells were assessed ± DEAB (negative control). POS-percentage of cells that are ALDH positive.

