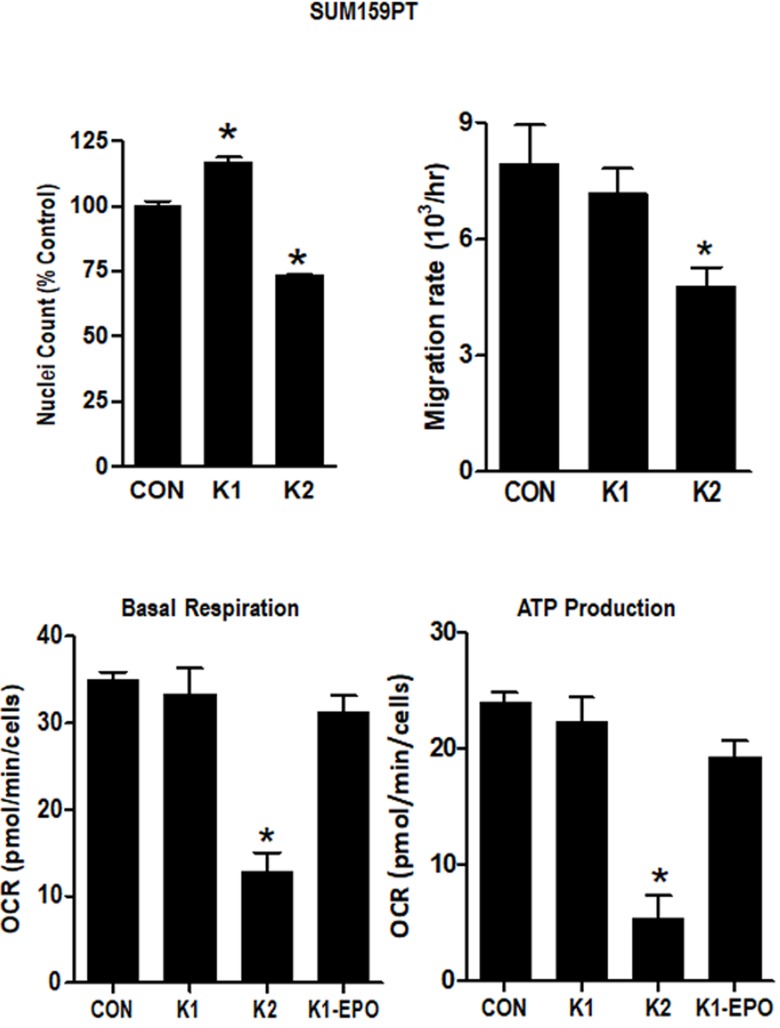
Figure 6. Effect of vitamins K1 and K2 on nuclei counts, migration rates and metabolism in SUM159PT cells.
Cells were maintained in standard media supplemented with EtOH vehicle or 5 μg/ml K1, K2, or K1-EPO for > 3 passages. For nuclei count, cells were formaldehyde-fixed, incubated with Hoechst, and imaged on the IN Cell Analyzer. For migration assays, confluent monolayers were scratched and imaged live on an EVOS live cell imaging system (ThermoFisher Scientific). For metabolism assays, cells were analyzed with the Seahorse XF Cell Mito Stress Test (Agilent). Basal Respiration and ATP Production were calculated with WAVE software (Agilent) after normalization by DNA content. Bars represent mean ± SD of 3 technical replicates. *Significantly different from CON (p < 0.05) as measured by one-way ANOVA and Tukey post-test.

