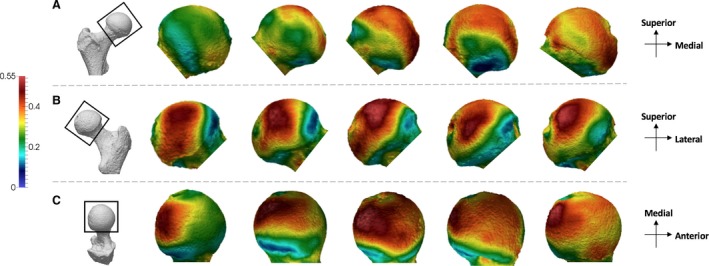
Figure 5.

Homo BV/TV distribution in the femoral head. Five Homo specimens showing variation in the BV/TV distribution across the sample in (A) anterior, (B) posterior and (C) superior views. BV/TV is scaled to 0–0.55. All specimens are from the right side. Specimens from left to right (F, female; M, male): CAMPUS 36 (F), CAMPUS 93 (M), CAMPUS 74 (F), CAMPUS 417 (sex unknown), CAMPUS 81 (M).
