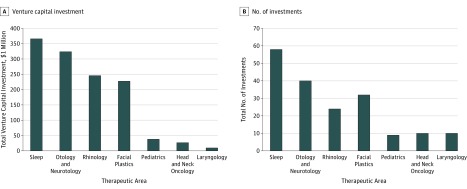
Figure 2. Total Venture Capital Investment in Therapeutic Otolaryngologic Device Firms.
Data were acquired for the period from January 1, 2008, through December 31, 2017, and stratified by therapeutic area. Excludes 27 investments of undisclosed amount. Adapted with permission from PitchBook.5

