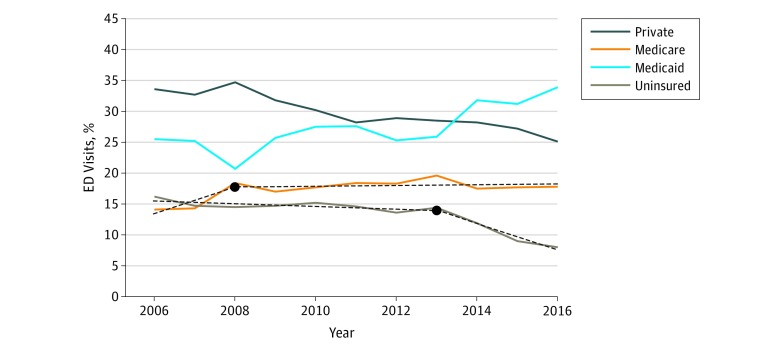
Figure 2. Percentages of US Emergency Department (ED) Visits by Insurance Type, 2006 to 2016.
Solid lines denote actual data. Solid lines without superimposed dashed lines indicate that the best regression line was linear, ie, no change in slope. Dashed lines indicate models that had a significant change in slope at some time point. Year at which the slope changed is shown as a black circle.

