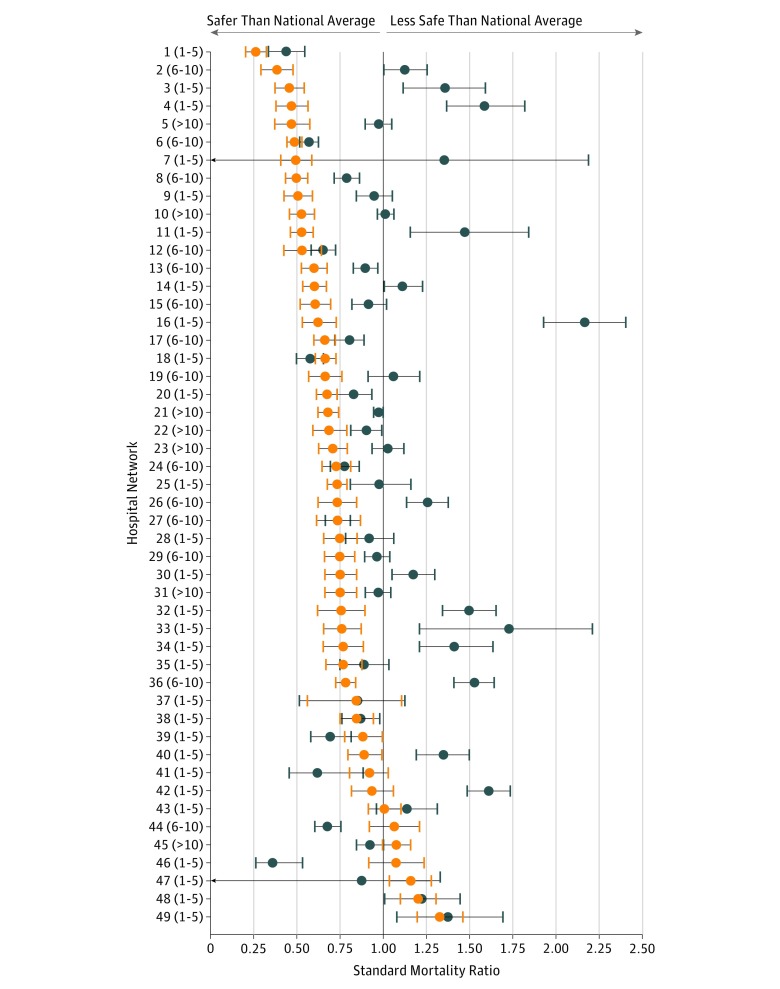
Figure 2. Comparison of Standardized Mortality Ratio at Top-Ranked Hospitals and Their Collective Affiliates.
The standardized mortality ratio (x-axis) of each top-ranked hospital is shown (orange) alongside its collective affiliates (blue) with bootstrapped 95% CIs (error bars). Hospital networks ordered by lowest top-ranked hospital standardized mortality ratio (network = 1) to highest top-ranked hospital standardized mortality ratio (network = 49), with the number of affiliated hospitals within each network in parentheses. For the number of affiliated hospitals within each network, ranges were used instead of exact values to preserve cancer hospital network confidentiality. The national mean standardized mortality ratio of 1 is based on a model including all hospitals that performed cancer surgery during the study period to avoid endogeneity.

