
4.
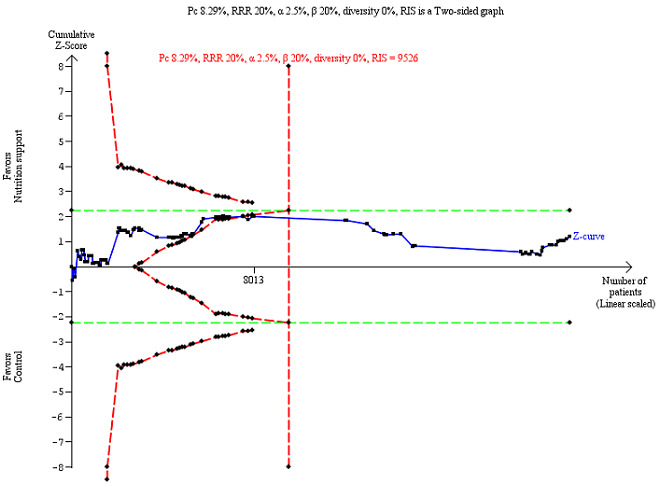
Trial Sequential Analysis on all‐cause mortality (end of intervention) in 114 high risk of bias trials. The diversity‐adjusted required information size (RIS) was calculated based on mortality in the control group of 8.29%; risk ratio reduction of 20% in the experimental group; type I error of 2.5%; and type II error of 20% (80% power). No diversity was noted. The required information size was 9526 participants. The cumulative Z‐curve (blue line) did not cross the trial sequential monitoring boundaries for benefit or harm (red inward sloping lines). The cumulative Z‐curve crossed the inner‐wedge futility line (red outward sloping lines). Additionally the cumulative Z‐score crossed the RIS. The green dotted line shows conventional boundaries (2.5%).