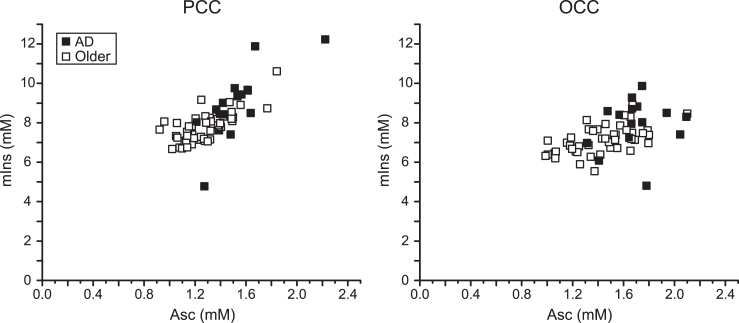
Fig.2.
Correlation between Asc and mIns in the PCC and the OCC. Regression plots of Asc concentration with mIns concentration in the studied brain regions of older adults with AD and controls. Significant correlations were observed in both brain regions (PCC: r = 0.76, p = 1×10–12; OCC: r = 0.50, p = 4×10⁻⁵).

