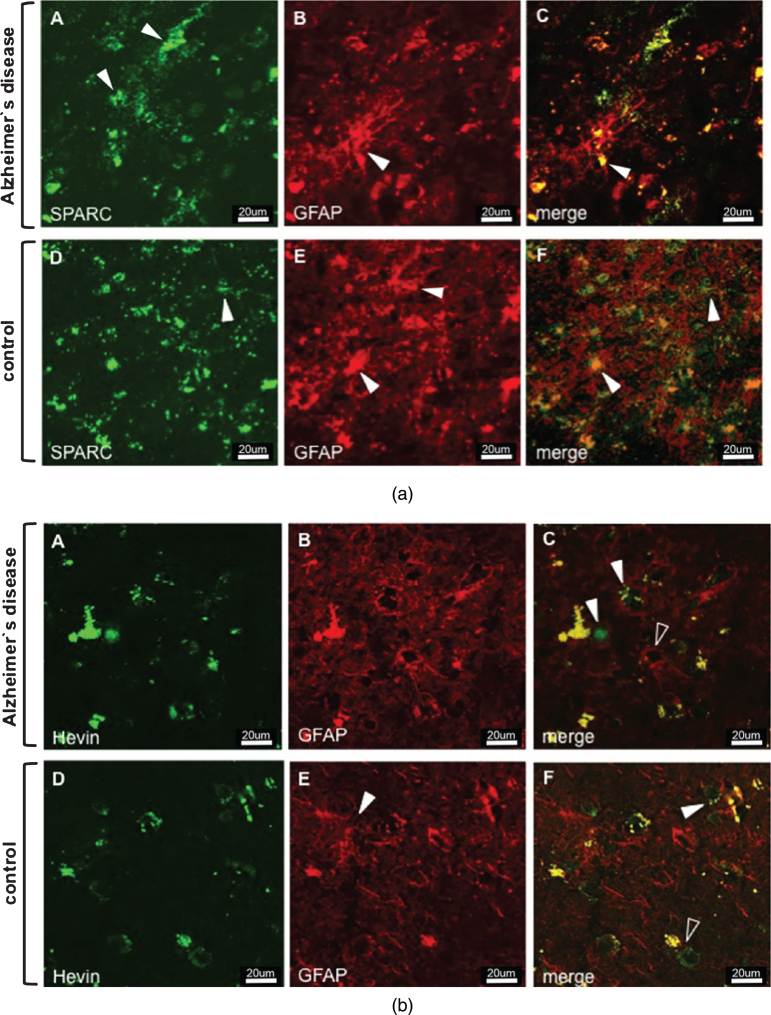
Fig.1.
a) Immunostaining of SPARC and astrocytes in AD (images A–C) and control tissue (images D–F). Series A–C depicts increased AD-associated SPARC expression as compared to control tissue. The extracellular distribution of SPARC (arrowheads in A) is not associated with reactive AD astrocytic GFAP expression (arrowhead in B). Images D–F show that extracellular SPARC (arrowhead in D) is not associated with quiescent control astrocytes (arrowheads in E). Lipofuscin fluoresces in both the red and green channels and appears yellow in the merged images (arrowhead in G and F). b) Immunostaining of Hevin and astrocytes in AD (images A–C) and control tissue (images D–F). Hevin is expressed to a lesser extent in AD samples and is clearly not associated with astrocytic activity, cf. arrowheads in image C. Instead, astrocytes seem to gather around neurons (arrowhead, image C) and blood vessels (open arrowhead, image C). Control tissue has distinct Hevin positive cells that are likely to be neurons (arrowhead, image F) and other cell types (open arrowhead, image F). Yellow structures in C and F are lipofuscin in degenerate neurons or extracellular deposits.

