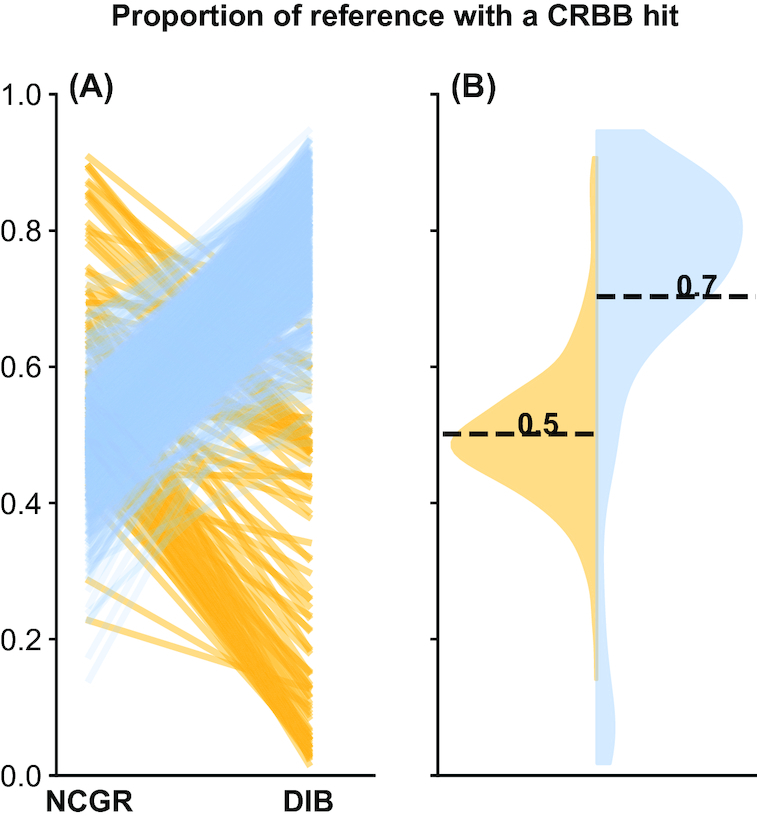
Figure 3:

(A) Slope graphs comparing the proportion of CRBB hits between NCGR 'nt' assemblies and DIB assemblies between the same samples. (B) Violin plots showing the distribution of the proportion of NCGR transcripts with reciprocal Basic Local Alignment Search Tool (BLAST) hits to DIB (blue) and the proportion of DIB transcripts with reciprocal BLAST hits to NCGR (yellow).
