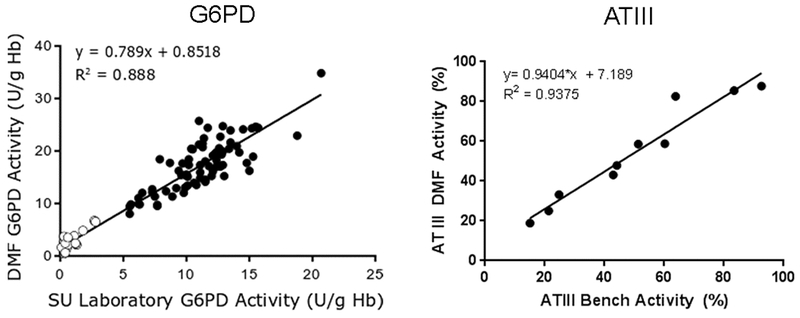
Figure 5.

Comparison of G6PD enzyme activity results of same set of samples measured using the DMF assay (Y axis) and the Stanford Medical Center standard reference method (X axis) are shown in the left panel. Open circles denote deficient samples while solid circles denote normal samples. ATIII functional activity results of samples measured using the DMF assay (Y axis) are compared with the Boston Children’s Hospital standard reference method (X axis) in the right panel. Data modified from [74] and [63] by permission of Oxford University Press.
