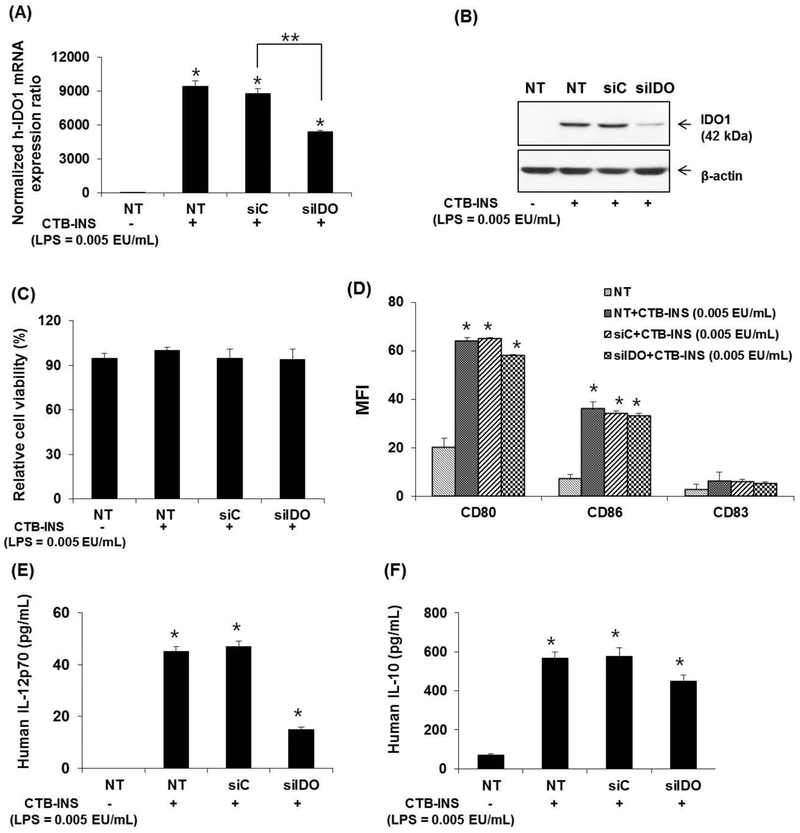
Figure 6. Effects of the inhibition of IDO1 on CTB-INS treated DCs.
Panel (A) is a graphic representation of quantitative real time-PCR (RT-qPCR) analysis of human IDO1 mRNA levels synthesized in untreated (NT) or LPS free CTB-INS (LPS = 0.005EU/mL) treated moDCs transfected with human IDO1-specific small interfering RNA (siIDO1), or a negative control siRNA (siC). IDO1 gene expression was normalized in comparison with β-actin gene expression. Panel (B) Western blot analysis of IDO1 protein synthesis in moDCs treated with CTB-INS and transfected with IDO1-specific siRNA (siIDO) or negative control (siC) using human anti-IDO1 as the primary antibody. Panel (C) Viability of CTB-INS treated human moDCs after transfection with IDO1-specific siRNA (siIDO). DC viability was measured as the percentage of CTB-INS treated DCs negative for uptake of viability dye FVD450. Panel (D) Graphic representation of siRNA inhibition of IDO1 effects on LPS free CTB-INS activation of DC costimulatory factor biosynthesis measured by flow cytometry (MFI). Panels (E and F) graphic representation of ELISA quantification of secreted IL-12p70 and IL-10 cytokines from LPS free CTB-INS treated moDCs. The graph bars represent the mean of three independent experiments. NT− = siIDO1 RNA transfected DCs in the absence of LPS free CTB-INS fusion protein treatment. NT+ = siIDO1 RNA transfected DCs treated with CTB-INS (LPS = 0.005 EU/mL). The DC samples were assayed in triplicate and the data represent the mean ± SD of three independent experiments. *p < 0.05, compared with the NT and **p < 0.05 in comparison with siC.

