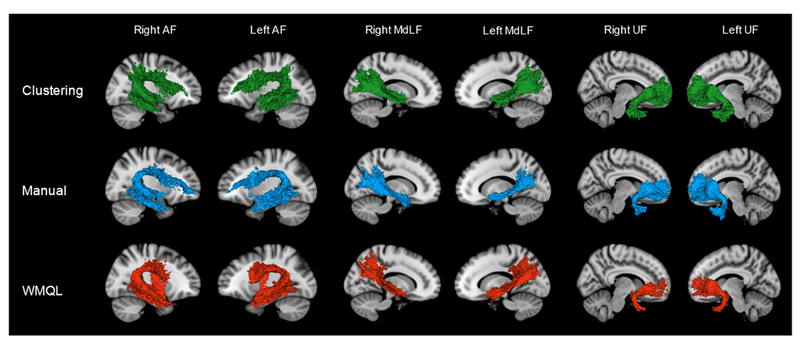
Figure 3.

3D Models of the method-specific tract overlay maps generated by Data-Driven Groupwise Fiber Clustering (green), Manual Multiple-ROI Labeling (blue) and the White Matter Query Language (red). Method-specific tract overlay maps were obtained by overlaying binarized tract masks from all 10 subjects in MNI152 space and labeling voxels that were present in at least 50% of subjects, thus capturing the degree of intra-method tract overlap.
