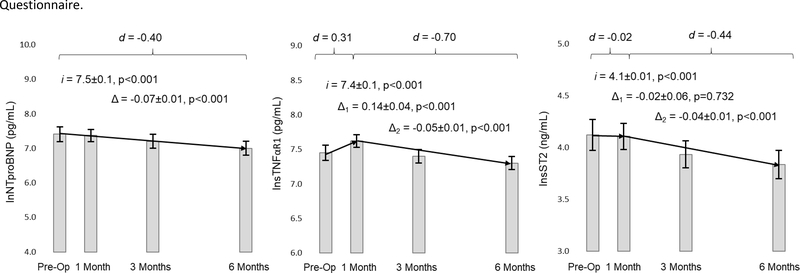
Figure 2: Changes in Biomarkers in Response to Left Ventricular Assist Device Implantation.
Mean values of each biomarker are presented as the filled rectangle and the whisker bars represent the 95% confidence interval for each time point. Horizontal lines for each graph represent overall change (Δ) in the case of NTproBNP or the initial change between pre-implant and 30 days post implant (Δ1) and the subsequent change (Δ2) through 180 days after implantation in the case of sTNFαR1 and sST2. Latent growth modeling estimates of pre-implant values (i for intercept) and phases of change are presented along with the standard error and related p-values. Finally, effect sizes overall or for each phase of change are presented in Cohen’s d (d). Raw values are presented to assist with interpretation. The natural log of biomarker levels is what was used in the analysis to approximate normality. Abbreviations: ln = natural logarithm; NTproBNP = amino terminal pro-B-type natriuretic peptide; sST2 = soluble form of suppression of tumorigenicity-2; sTNFαR1 = soluble tumor necrosis factor alpha receptor 1.

