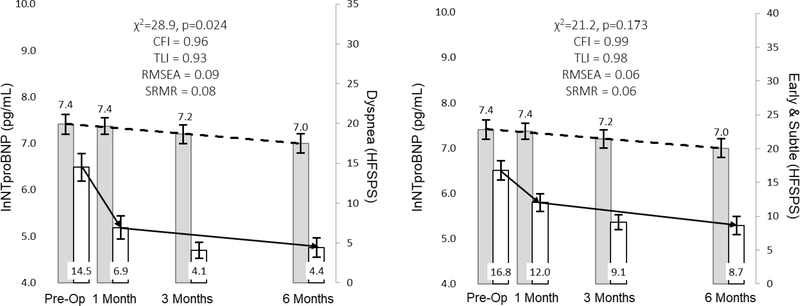
Figure 3: Parallel Changes in Myocardial Stretch and Physical Symptoms in Response to Left Ventricular Assist Device Implantation.
Mean values of biomarkers (leftward y-axes) and symptoms (rightward y-axes) are presented as the filled rectangle and the whisker bars represent the 95% confidence interval for each time point. Horizontal lines (dashed lines for biomarkers, solid lines for symptoms) for each graph represent overall change between pre-implant and 180 days post implant. Thresholds for acceptable fit for CFI and TLI are ≥ 0.95, RMSEA = ≤0.06 and SRMR ≤ 0.08. Abbreviations: CFI = comparative fit indices; HFSPS = heart failure somatic perception scale; lnNTproBNP = natural log of amino terminal pro-B-type natriuretic peptide; RMSEA = root mean square errors of approximation; SRMR = standardized root mean square residual; TLI = Tucker-Lewis indices.

