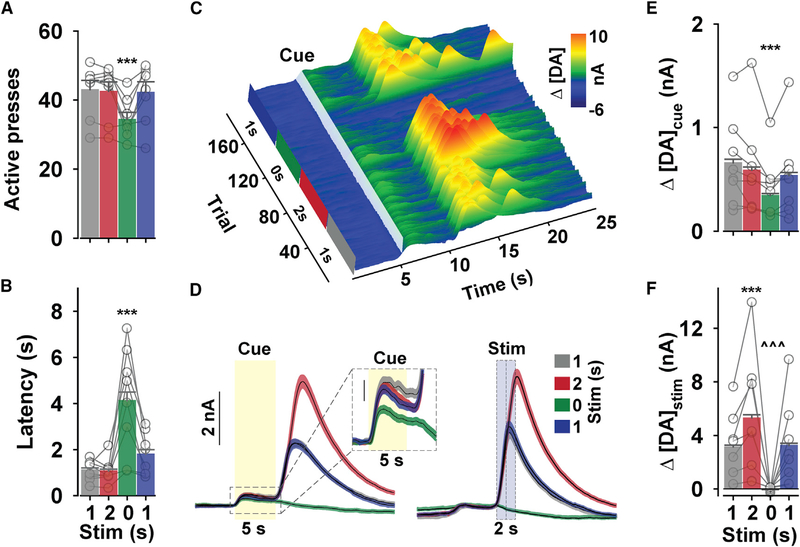
Figure 5. NAc DA Release during Changing Stimulation Magnitudes.
(A and B) Mean (+ SEM) active lever presses (A; one-way RM ANOVA: F(3,24) = 15.76, p < 0.001) and latency to press (B; one-way RM ANOVA: F(3,950) = 44.39, p < 0.001) during consecutive 30-min periods at each stimulation.
(C) Representative Δ[DA; z axis) time-locked to cue onset over time (x axis) and across trials (y axis).
(D) Mean (± SEM) Δ[DA]cue (left, yellow transparent box) and Δ[DA]stim (right, blue transparent box).
(E and F) Mean (+ SEM) peak Δ[DA]cue (E; one-way RM ANOVA: F(3,988) = 17.19, p < 0.001) and A[DA]stim (F; one-way RM ANOVA: F(3,950) = 240.62, p < 0.001). Symbols in (A) referto refer to total count for each mouse (n = 8), and symbols in (B), (E), and (F) refer to mean for all trials (latency, n = 1,297; Δ[DA]cue, n = 1,335; Δ[DA]stim, n = 1,297) during each stimulation epoch. ***p < 0.001 versus all other stimulation epochs. ^^^p < 0.001 versus both 1 s stimulation epochs. See also Figure S8.

