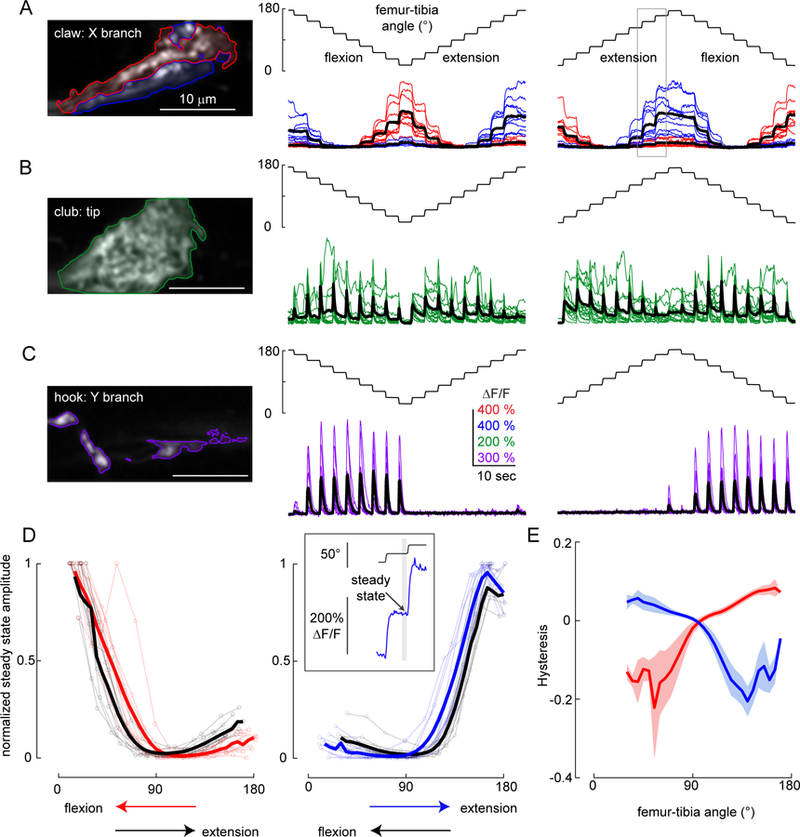
Figure 5. Claw neurons encode joint position, club neurons encode bidirectional movements, and hook neurons encode movement direction.

A. Responses of position-encoding claw neurons (R73D10-Gal4) to ramp-and-hold stimuli. Left column: Average GCaMP6f fluorescence from the X branch of the claw projection where the example recordings were made (red: flexion encoding, blue: extension encoding). Middle column: Responses from the two regions to a ramp-and-hold stimulus that starts with the joint extended (n = 10 flies). Right column: Same as above but starting with the joint flexed. The grey rectangle indicates the location of the trace shown in the top inset in D. B. Same as A, but for club neurons (R64C04-Gal4), which increase their activity phasically in response to each step (n = 14 flies). C. Same as A and B, but for hook neurons (driven by R21D12-Gal4), which only respond during flexion (n = 9 flies). D. Calcium signals of claw neurons depend on movement history. Left column: steady state ∆F/F at different joint angles for the flexion activated (red: during flexion, black: during extension, thick lines: average response) sub-branches of the claw, normalized by the maximum peak response recorded in each fly (n= 10 flies). Steady-state responses were measured at the end of the hold step (top inset at right). In these recordings, flexion preceded extension. Right column: Same as the left column but for the extension activated (blue: during extension, black: during flexion, thick lines: average response) sub-branches of the claw (n = 10 flies). In these recordings, extension preceded flexion. E. Hysteresis (difference between the response to the activating direction and the non-activating direction) of the steady-state response for flexion (red) and extension (blue) activated sub-branches of the claw (thick lines: average response, shading: standard error of the mean).
