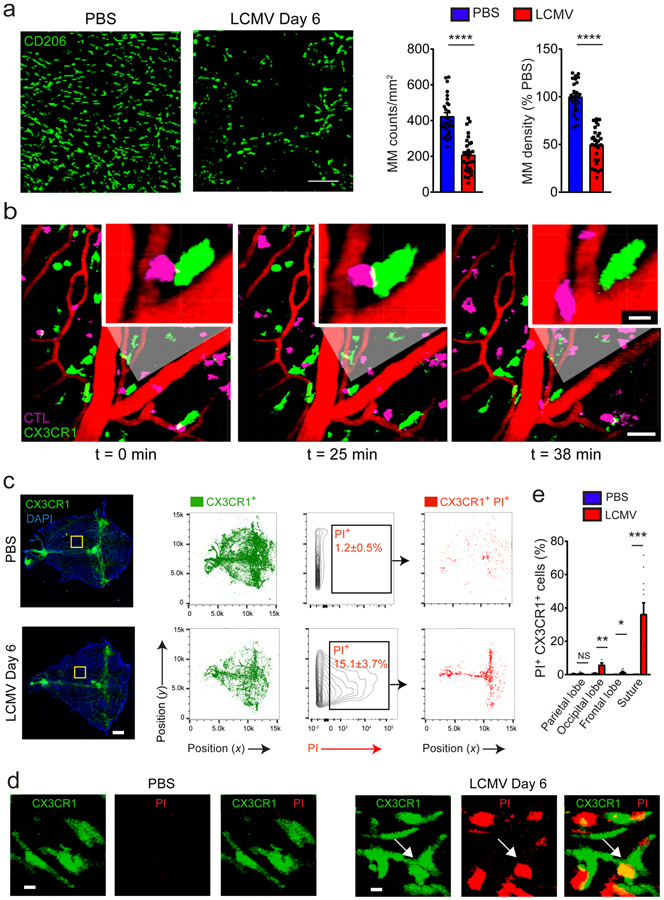
Figure 3. MM numbers diminish at the peak of meningitis.
(a) Meningeal whole mount stain of CD206+ cells (green) of PBS (left panel) vs. LCMV-injected (middle panel) mice at day 6 and quantification of cell density (right panel). Scale bar: 30μm. The absolute number of MMs and their percent reduction relative to the control group were calculated by histocytometry based on a sampling of the meninges beneath the frontal, parietal, and interparietal bones as well as the lamboid and sagittal sutures. Bar graphs show the mean ± SEM for the indicated groups, and asterisks denote statistical significance (****p<0.001, unpaired two-tailed Student’s t test). Data are representative of two independent experiments with twenty-eight regions per group. (b) A representative time lapse captured by two-photon microscopy through the thinned skull of a day 6 LCMV-infected Cx3cr1gfp/+ mouse shows DbGP33–41 specific (P14) CTL (pink) interacting with Cx3cr1-GFP+ macrophages (green) at the denoted time points. Scale bar: 50μm. The insets show a magnified view of an interaction. Scale bar: 10μm. Blood vessels are visualized by Evans Blue (red). See corresponding Supplementary Video 3. Data are representative of five independent mice. (c) Images of meningeal whole mounts (left panels) and corresponding histocytometric plots (middle panels) of the meninges from Cx3cr1gfp/+ mice 6 days after following injection of PBS or LCMV. Mice were injected i.p. with propidium iodide 1 hour before sacrifice to localize dead cells. Cx3cr1-GFP+ surfaces (green) were gated and plotted on a separate xy axis to quantify the percentage of myeloid cells that were PI+. Percentages of PI+ cells are denoted in the black boxes and the anatomical position of these cells (red) is shown in the adjacent plots. Scale bar: 1mm. Data are representative of two independent experiments with two mice per group. (d) Magnified images denoted by yellow boxes in (c) depict PI+ (red) Cx3cr1-GFP+ (green) MMs after LCMV infection. Scale bar: 5μm. Data are representative of two independent experiments with four mice per group. (e) The bar graph shows the percentage of Cx3cr1-GFP+ PI+ cells in the denoted meningeal regions for PBS vs. LCMV-injected mice at day 6. Graphs show the mean ± SEM for the indicated groups, and asterisks denote statistical significance (*p<0.05, **p<0.01, ***p<0.001, unpaired two-tailed Student’s t test). Data are representative of two independent experiments with four (occipital), eight (parietal and frontal) or eleven (suture) regions per group.

