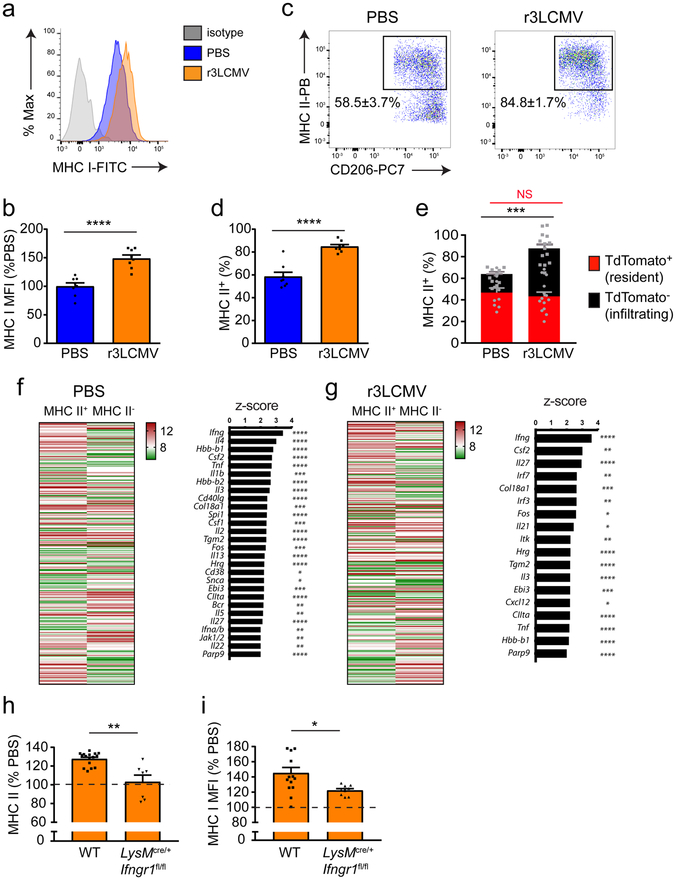
Figure 6. IFNγ promotes engraftment of the meninges by peripheral MHC II+ cells.
(a-d) At day 30 post infection, MMs (gated on LiveDead− CD45+ Thy1.2− CD11b+ Ly6C− Ly6G− F4/80+ CD206+ cells) were analyzed flow cytometrically for MHC I (a,b) and MHC II (c,d) expression and compared to mock-infected controls. Representative FACS plots (a,c) and the corresponding bar graphs (b,d) demonstrate a statistically significant increase in MHC I and MHC II levels on MMs from mice previously infected with r3LCMV relative to the mock-infected control group. Bar graphs show the mean ± SEM for the indicated groups, and asterisks denote statistical significance (****p<0.0001, unpaired two-tailed Student’s t test). Data are representative of two independent experiments with eight mice per group. (e) A similar experiment was performed using Cx3cr1CreER/+ x Stopfl/fl TdTomato mice. Bar graphs show the mean ± SEM for the indicated groups, and asterisks denote statistical significance. In day 30 r3LCMV-infected mice, a significant increase was observed in the proportion of MHC II+ TdTomato− cells (infiltrating myeloid cells) (***p<0.01; unpaired two-tailed Student’s t test), but not MHC II+ TdTomato+ cells (NS, not significant; unpaired two-tailed Student’s t test). Meningeal macrophages were gated on LiveDead− CD45+ Thy1.2− CD11b+ Ly6C− Ly6G− F4/80+ CD206+ cells. Data are representative of four independent experiments with ten (PBS) and fourteen (r3LCMV) mice per group. (f,g) Microarray analysis was performed on RNA extracted from sorted MHC II+ MMs of mice injected with PBS (f) and LCMV (g) 30 days prior and compared to MHC II− MMs. Data are representative of four independent experiments with ninety mice per group. Meningeal macrophages were gated on LiveDead− Thy1.2− CD45.2+ CD11b+ Ly6C− Ly6G− F4/80+ CD206+ and I-Ab/I-Eb positive (MHC II+ MM) or I-Ab/I-Eb negative (MHC II− MM). Heat maps in f and g depict differentially regulated genes between MHC II+ vs. MHC II− MMs (p<0.05, Welch-modified t-test under BH FDR multiple comparison correction conditions; greater than 1.5-fold). Each column shows color coded mean relative expression levels. See corresponding Supplementary Table 2. Bar graphs in f and g depict the top upstream regulators of the gene expression patterns in MHC II+ vs. MHC II− MM. Bars represent z-scores, and p-values at the intersections (*p<0.05, **p<0.01, ***p<0.001, ****p<0.0001, right-tailed Fisher’s exact test using no multiple comparison correction) are indicated. Only z-scores ≥ 2 or ≤ −2 were plotted. For a complete list of differentially regulated genes see Supplementary Table 2 (‘Gene_Expression_PBS’ and ‘MHC II+_upstream_regulatorsPBS’ tabs for mock-infected mice; ‘Gene_Expression_LCMV’ and ‘MHC II+_upstream_regulatorsLCMV’ tabs for the r3LCMV-infected mice). (h,i) At day 30 post-r3LCMV infection, MMs from littermate wild type (WT) vs. LysMCre/+ x Ifngr1fl/fl mice were analyzed flow cytometrically for MHC II (h) and MHC I (i) expression and compared to mock-infected mice. MMs were gated on LiveDead− Thy1.2−CD45.2+ CD11b+ Ly6C− Ly6G− F4/80+ CD206+. Data are represented as a percentage relative to mock-infected control mice. (*p<0.05, **p<0.01; unpaired two-tailed Student’s t test). Bar graphs show the mean ± SEM for the indicated groups, and the dashed line represents the mock-infected control. Data are representative of five independent experiments with sixteen (WT) and seven (LysMCre/+ x Ifngr1fl/fl) mice per group (MHC II) or fourteen (WT) and nine (LysMCre/+ x Ifngr1fl/fl) mice per group (MHC I).

