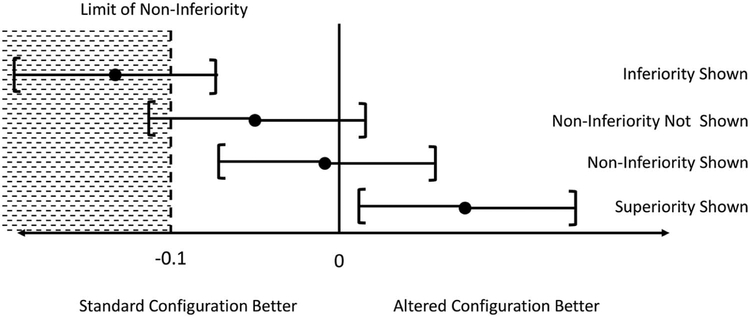
Figure 2.
Graphical demonstration of non-inferiority forest plot interpretation, with each dot representing the estimated difference in performance in the JAFROC figure of merit between the routine dose and lower dose configuration, with bars representing the 95% confidence intervals for this estimate. For lower doses that demonstrate non-inferiority compared to routine dose, the lower limit of the 95% confidence interval for the difference in performance (i.e., the left bar) will be above (or to the right of) the limit of non-inferiority.

