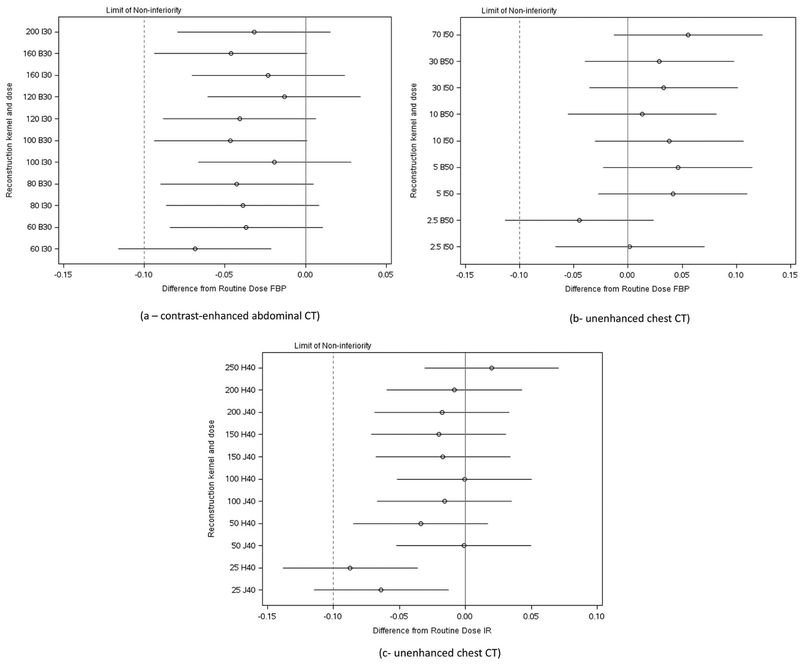
Figure 4.
Forest plots indicating estimated differences in observer performance of between routine dose and reconstruction method and lower dose configurations using JAFROC figures of merit. The dotted line represents the limit of non-inferiority selected for this study (i.e., −0.10). Point estimates are given by circles, with lines representing the 95% confidence intervals in the estimated differences. When the lower limit of the 95% confidence interval lies to the right of the limit of non-inferiority, the lower dose is shown to be non-inferior. Radiation doses are given corresponding to the automatic exposure control setting of the CT scanner (in quality reference mAs) for each lower dose configuration, as CT systems modulate tube current appropriately for patients of different sizes. Reconstruction kernels are given as named by the CT manufacturer using a letter and number, with “B” and “H” kernels used in FBP, and “I” and “J” kernels corresponding to IR kernels.

