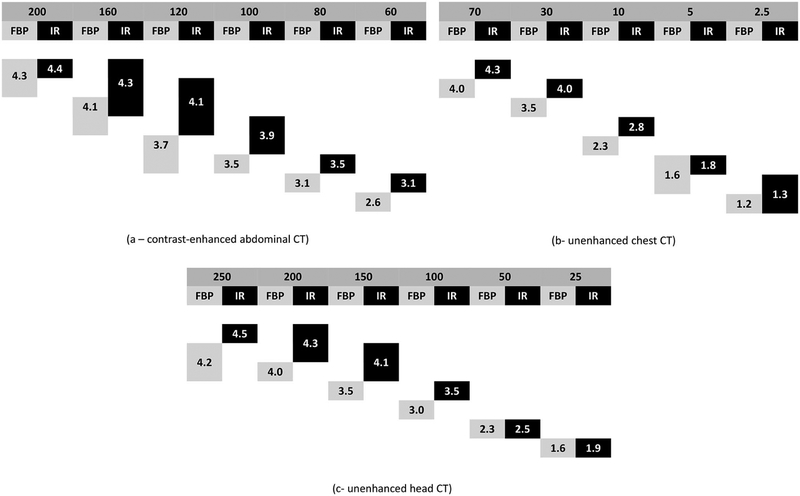
Figure 5.
Subjective measures of diagnostic image quality pooled across three subspecialized radiologists for the three common diagnostic tasks in CT imaging for the routine and lower dose configurations. The top line shows the radiation doses corresponding to the automatic exposure control setting or tube current, as appropriate, and the second line lists the reconstruction type (FBP or IR). Boxes below indicate the spread of diagnostic image quality scores. For each dose level, significant differences in diagnostic image quality exist when boxes do not overlap (i.e., share an adjacent side).

