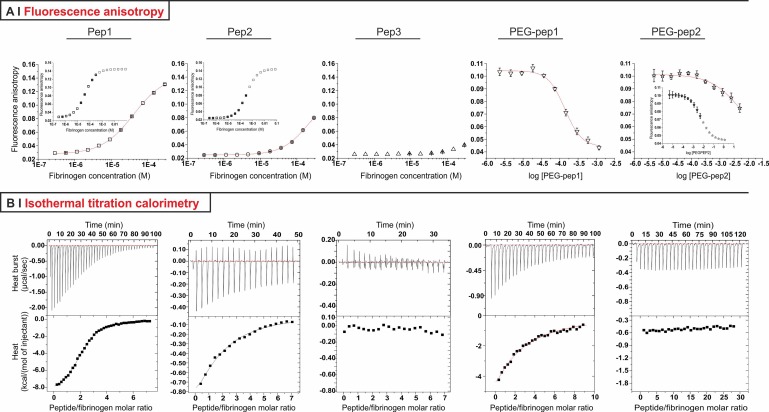
FIG. 1.
(a) FA curves for the binding of fluorescently labelled peptides 1, 2, and 3 to fibrinogen and for the competitive binding of PEG-pep1 and PEG-pep2 (displacement of 5IAF-pep1 and 5IAF-pep2 from fibrinogen, respectively). Insets present the results of fitting procedures with a Hill model for Pep1 and Pep2, and with a dose-response model for PEG-pep2. (b) ITC profiles for the binding of Pep1, 2 and 3, and PEG-pep1 and 2 to fibrinogen. Raw data (top) and integrated heats (bottom) are presented in all cases.

