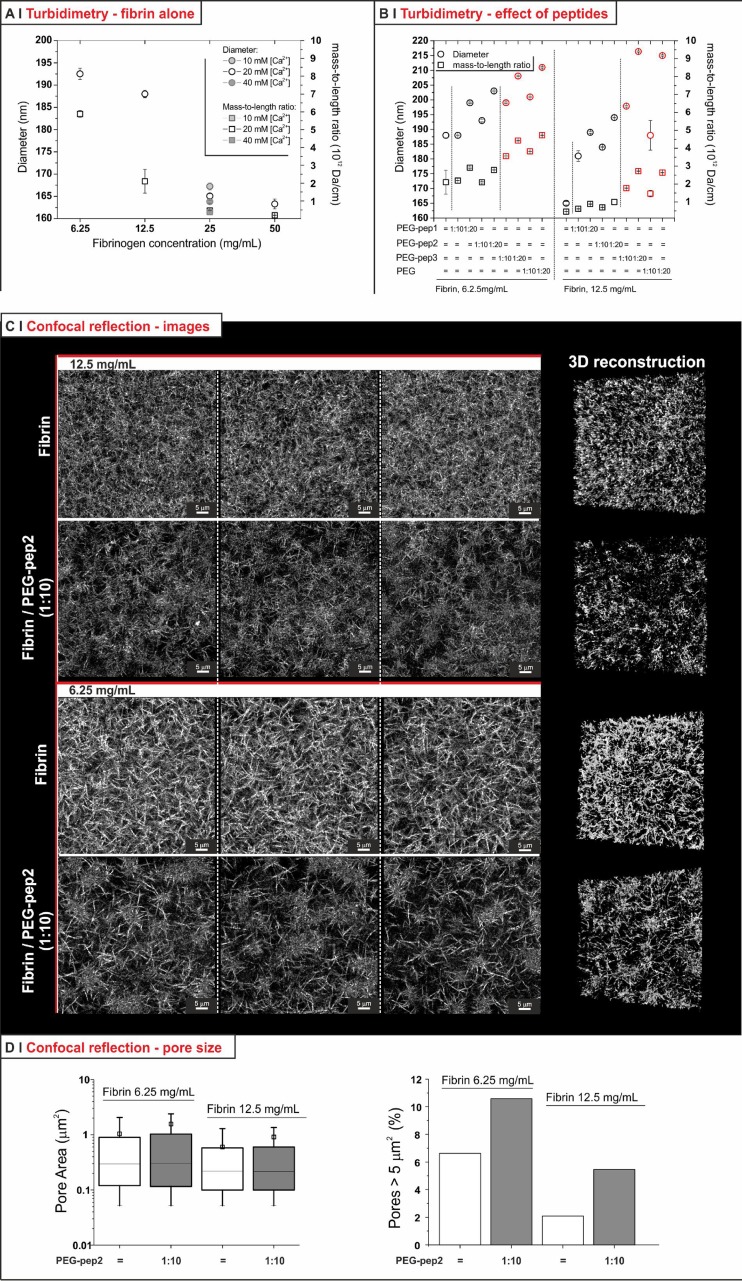
FIG. 6.
(a) Diameter and mass-to-length ratio of fibres in hydrogels with different fibrinogen (6.25, 12.5, 25, and 50 mg/ml) concentrations produced with 20 mM calcium; the gels at 25 mg/ml were also produce with 10 and 40 mM calcium (n = 3). (b) Diameter and mass-to-length ratio of fibres produced in the presence of different PEG-peptides at a fibrinogen concentration of 12.5 or 25 mg/ml, and with fibrinogen/PEG-peptide molar ratio of 1:10 or 1:20. Results for negative controls (PEG-pep3 and in this case also PEG at the same molar ratio) are shown in red for easy visualization (n = 3). (c) Confocal reflection images of fibrin gels at two different concentrations with and without 1:10 PEG-pep2 (left: confocal sections of different volumes recorded on the same sample for each gel; right: 3D reconstruction). (d) Pore size analysis from confocal reflection images. The pore area [left; the square symbols represent the mean values (±SD), the horizontal lines of the box the 25, 50 (median), and 75 percentile of the distribution] was calculated as described in supplementary material, Sec. 1.2SI (see also Fig. 4SI). The graph on the right hand size shows the percentage of very large (>5 μm2) pores.

