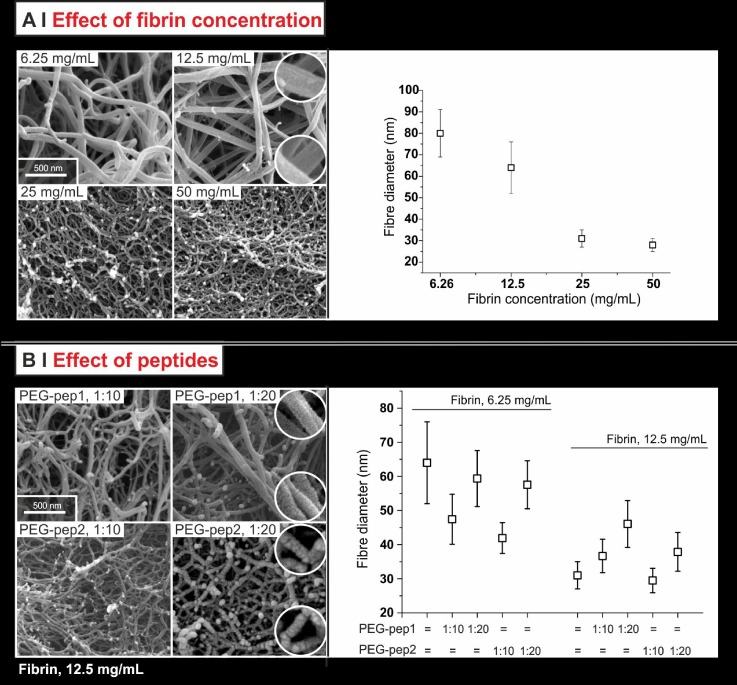
FIG. 7.
SEM images of fibrin networks (left) and their corresponding fibre diameter measurements (right) for pure fibrin gels [fibrinogen concentrations from 6.25 to 50 mg/ml, (a)] and for modified fibrin gels [12.5 mg/ml fibrinogen concentration + PEG-pep1 or 2 at 1:10 or 1:20 fibrinogen/PEG-peptide molar ratio (b)]. In the circles, magnified particulars are presented to show a different organization/roughness of the fibres produced in the presence of 1:20 PEG-peptides. Note that the diameters obtained from SEM refer to dehydrated fibres, and therefore are necessarily smaller than those recorded through turbidity measurements.

