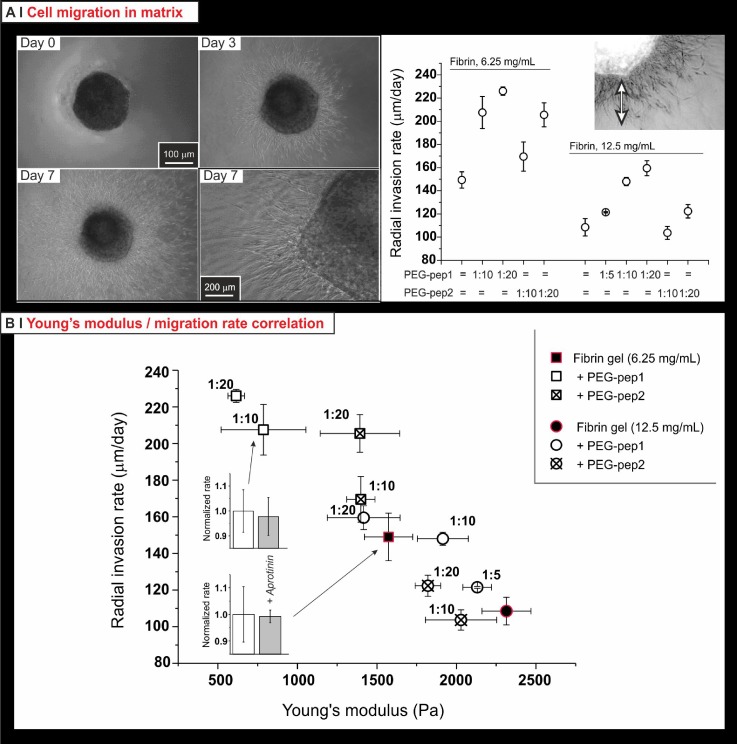
FIG. 8.
(a) Phase contrast images (left; the bottom right picture provides a high magnification view of the same system in the bottom left picture) and quantification (right) of the radial invasion of HDFa migrating from 1 μl drops of cell-laden fibrin clots (12.5 mg/ml, 30 000 cells/clot) embedded in the fibrin matrices. The rate is calculated from the average distance covered by the invading cell front, divided by time. (b) HDFa migration HDFa in either pure or hybrid fibrin gels well correlated with their softness (the softer, the quicker); importantly, control experiments (220 KIU of aprotinin in the media: grey bars in the two insets on the left) showed the migration not to be based on fibrinolysis.

