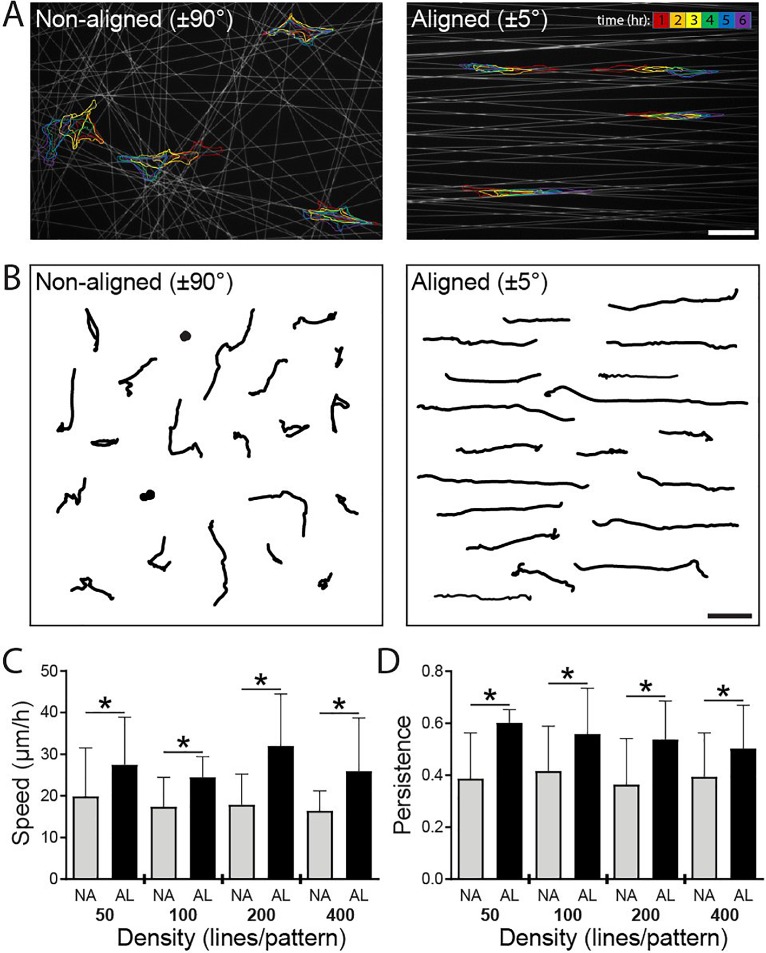
FIG. 4.
ECM alignment influences migration speed independent of ECM density. (a) Overlaid outlines of representative cells at the end of each hour (as denoted by color bar) over 6 h time-lapse imaging on non-aligned (NA, ±90°) and aligned (AL, ±5°) Fn-patterns (grey) containing 100 lines with a width of 1 μm. (b) 20 representative cell migration tracks measured over 6 h duration of time-lapse imaging on NA and AL patterns containing 100 lines with a width of 1 μm. Average migration speeds (c) and persistence (d) on NA and AL patterns containing 50, 100, 200, or 400 lines (n ≥ 10 cells per condition, ≥160 cells analyzed total, * indicates a significant difference with p < 0.05 vs. NA group at the same line density). Scale bars: 100 μm.

