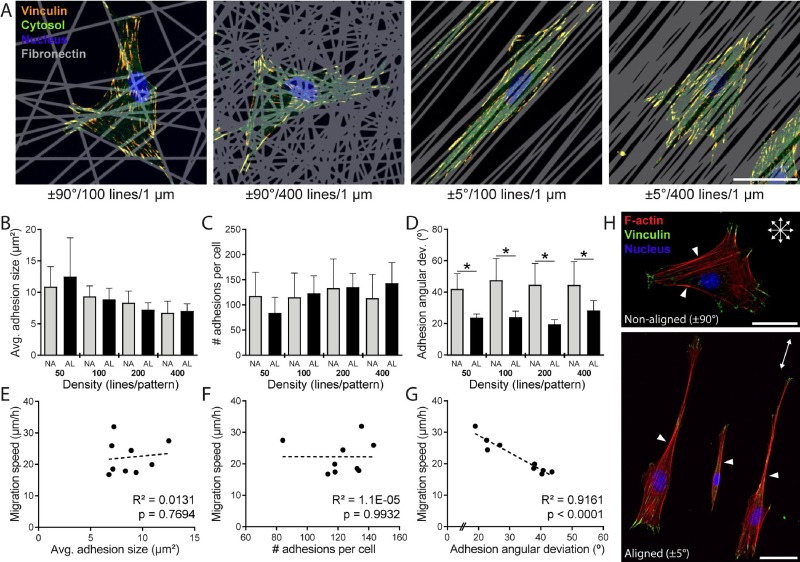
FIG. 5.
Focal adhesion organization parallels the alignment of ECM patterns. (a) Representative confocal images of 3T3 fibroblasts on non-aligned (±90°) and aligned (±5°) patterns with 100 or 400 line elements stained for vinculin to localize focal adhesions (yellow: anti-vinculin, green: cytosol, blue: nucleus, and grey: Fn555; scale bar: 50 μm). Average individual focal adhesion size (b), total number of adhesions per cell (c), and angular deviation of adhesion orientation within a given cell (d) for cells on non-aligned (NA, ±90°) and aligned (AL, ±5°) patterns containing 50, 100, 200, or 400 lines (n ≥ 9 cells analyzed per condition, total of 101 cells analyzed, * indicates a significant difference with p < 0.05 comparing AL vs. NA group at the same line density). (e)–(g) Correlations of average migration speed vs. average adhesion size (e), total number of adhesions per cell (f), and the angular deviation of FA orientation (g). Each data point represents the population average taken from a different pattern. Dashed lines indicate the linear regression lines, with R2 and p-values indicated within each plot. (h) Representative confocal images of fibroblasts on NA and AL patterns with 200 line elements stained for vinculin and F-actin (green: anti-vinculin, red: F-actin, and blue: nucleus; scale bars: 50 μm).

