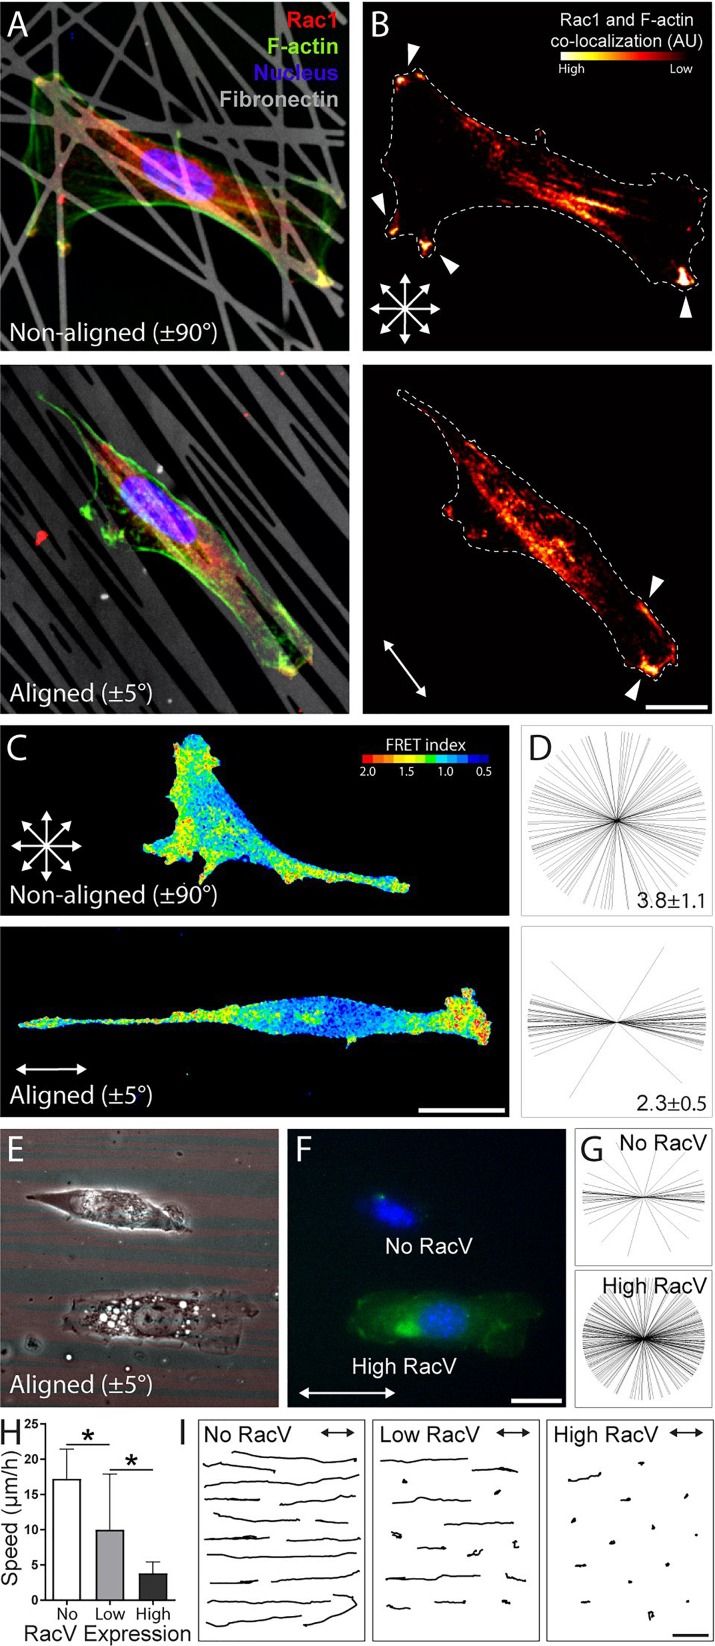
FIG. 7.
ECM alignment dictates the localization of Rac1-enriched extensions. (a) Representative confocal images and (b) corresponding heatmaps of 3T3s stained for active Rac on NA (top) and AL (bottom) patterns containing 100 lines with a width of 1 μm [red: active Rac (PBD-GST, anti-GST antibody), green: F-actin, blue: nucleus, and grey: Fn555; scale bar: 25 μm]. Heat maps indicate co-localization of Rac activity and F-actin. White arrows indicate the direction of pattern alignment (scale bar: 25 μm). (c) Maximum projections of confocal stacks of live-3T3 migration expressing a Rac1-PBD FRET biosensor. Pseudocolored intensity scales indicating that FRET activity was maintained for each condition; scale bars, 25 μm. (d) Starburst plots indicating the angle of Rac1-enriched protrusions on NA (top) and AL (bottom) patterns (n ≥ 15 cells for each condition) and the average number of active Rac1 protrusions per cell (mean ± standard deviation). (e) Corresponding phase and (f) fluorescence micrograph of representative transfected 3T3s that highly expressed (“High RacV,” green, bottom) and failed to express (“No RacV,” no fluorescence, top) the RacV12-GFP construct (red: Fn555, green: GFP, scale bar: 25 μm). (g) Starburst plots indicating the angle of active protrusions for non- and high expressers of the RacV construct (n ≥ 16 for each condition). (h) Migration speed as a function of RacV expression levels; cells were grouped into three expression levels: no, low, and high (n ≥ 15 for each condition, * indicates a significant difference with p < 0.05). (i) 15 representative cell migration tracks of 3T3s with no, low, and high RacV expression measured over 6 h duration on aligned patterns containing 100 lines (scale bar: 100 μm).

