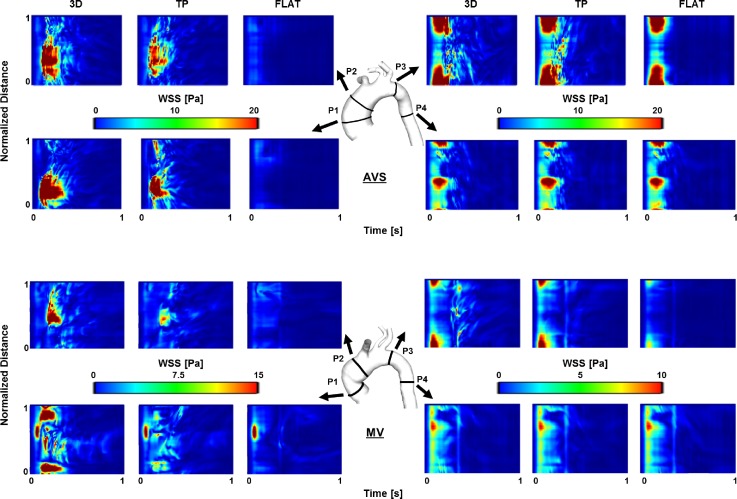
FIG. 8.
WSS (Pa) spatial and temporal maps for the two cases (AVS, top; MV, bottom). Maps were computed along four analysis planes, located in the ascending aorta, aortic arch, and proximal descending aorta (P1–P4, as shown). Planes are unwrapped along vertical axes, with distances along the circumference normalised for comparison purposes. The horizontal axes show the temporal evolution of the WSS values along the same plane.

