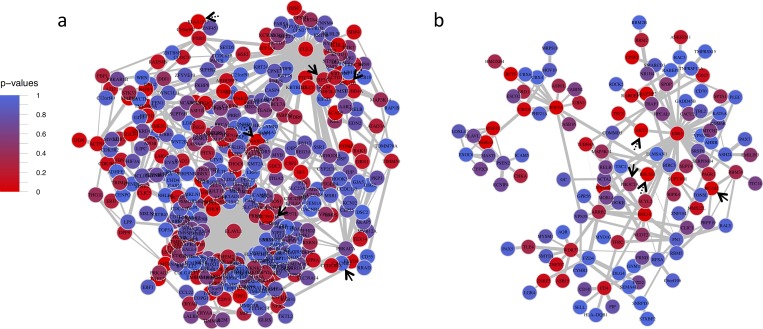
Fig 3. Prefrontal cortex mega modules aliceblue and cadetblue.
Prefrontal Cortex Mega Modules Cadetblue (a) and Aliceblue (b). Solid black arrows point to ALSPAC GWAS nominal genes, and dotted black arrows represent IASPSAD nominal genes. Edge-width is proportional to the difference in correlation strength between treatment and control mice, and node color represents IASPSAD GWAS p-values.

