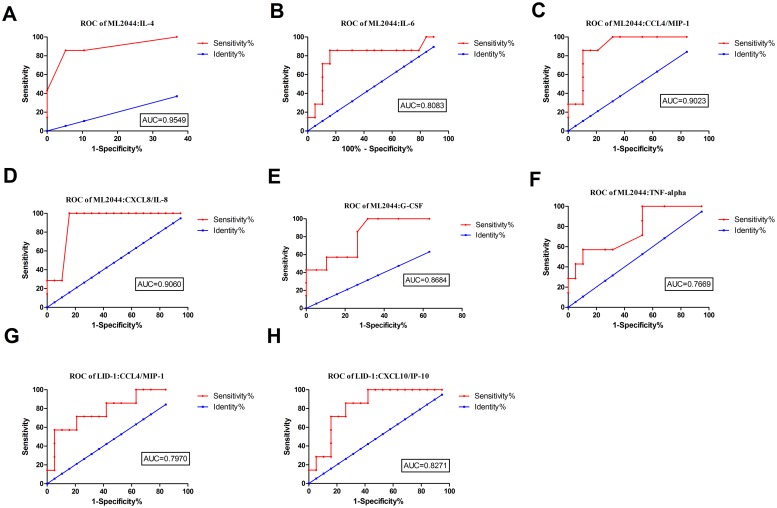
Fig 3. ROC curves showing the accuracy of host markers in discriminating between PB and TB patients.
ROC curves for the accuracy of single markers [IL-4 (A), IL-6 (B), CCL4 (C), CXCL8 (D), G-CSF (E), and TNF-α (F) induced by ML2044 and CCL4 (G) and CXCL10 (H) induced by LID-1] to differentiate between PB patients and TB patients. Only ROC curves for markers that differentiated between the two infection states with p value≤0.05 and AUC ≥ 0.73 are shown.

