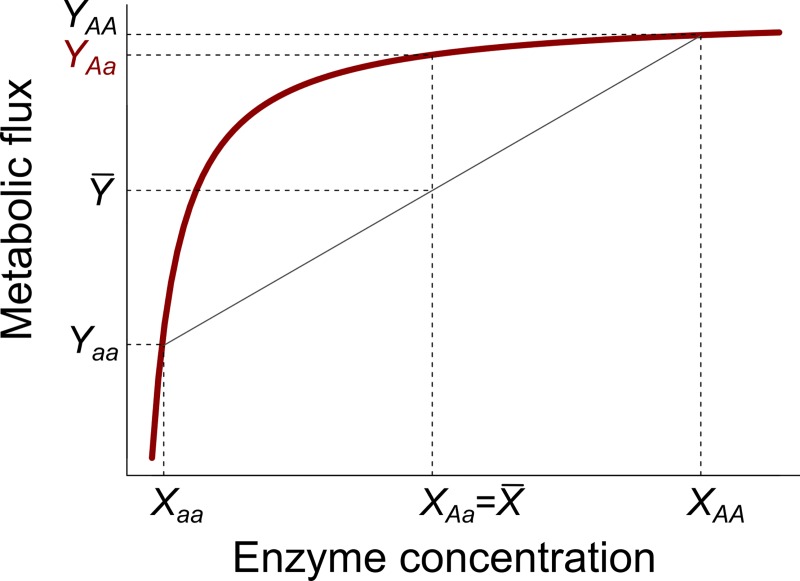
Fig 1. Wright’s model of physiological dominance.
The red curve represents the relationship between a metabolic flux (y-axis) and the concentration of one enzyme of the system (x-axis). The nonlinearity of the relationship results in dominance of allele A over allele a: the flux of the hybrid Aa is higher than the mean parental flux ( and represent mean enzyme concentration value and mean metabolic flux value between parent 1 [aa] and parent 2 [AA], respectively).

