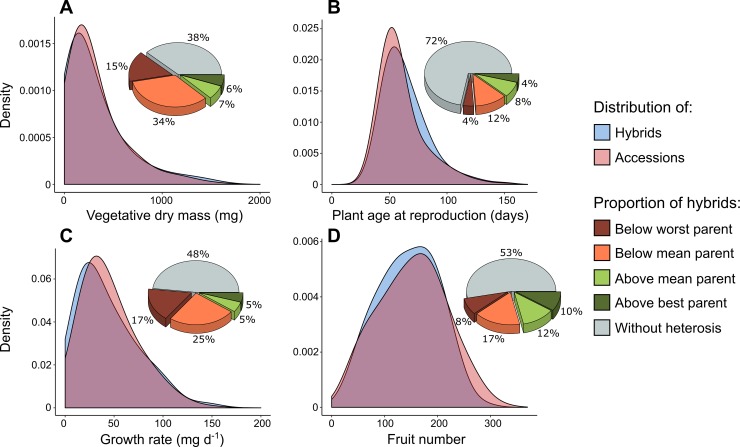
Fig 4. Distributions of traits and proportion of heterosis.
(A) Vegetative dry mass M in accessions (red) and hybrids (blue). Pie chart indicates proportion of crosses without and with significant heterosis. (B) Plant age at reproduction. (C) Growth rate. (D) Fruit number. Density represents KDE. KDE, kernel density estimation.

