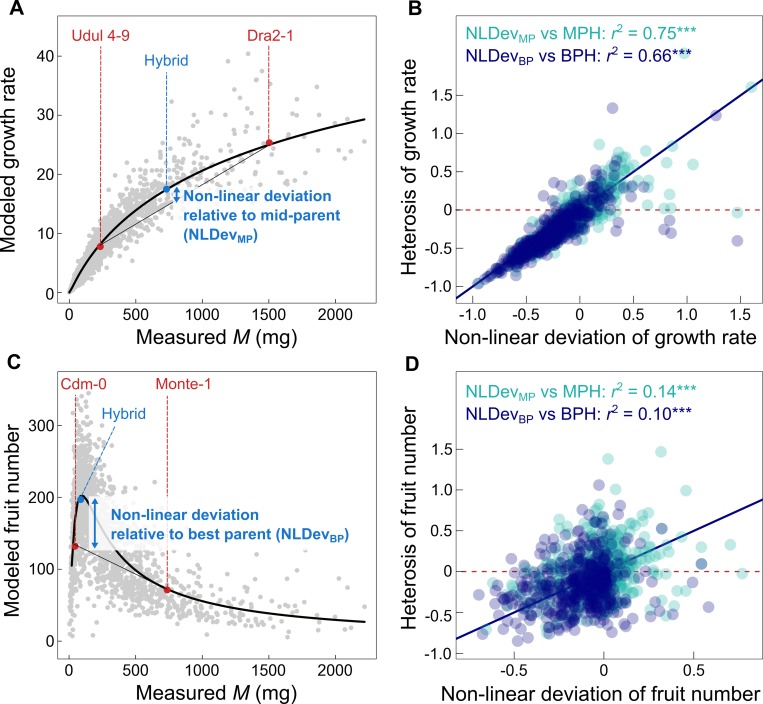
Fig 7. Prediction of heterosis with phenotypic nonlinearity.
(A) Allometric relationship of growth rate (g[M], black solid line) fitted in accessions, with an example of two parental accessions (Udul 4–9 and Dra2-1, in red) and their hybrid (in blue). NLDev (blue arrows) was calculated relative to mid-parent value (MPpred): NLDevMP = (g[M1 x 2] − MPpred) / MPpred and relative to best-parent value (BPpred): NLDevBP = (g[M1 x 2] − BPpred) / BPpred. (B) Correlation between NLDev and heterosis in all hybrids (n = 447), both relative to MPH (light blue) and BPH (dark blue). (C) Allometric relationship of fruit number (f[M], black solid line) fitted in accessions, with an example of two parental accessions (Cdm-0 and Monte-1, in red) and their hybrid (in blue). NLDev was calculated relative to mid-parent value (NLDevMP) and relative to best-parent value (NLDevBP). (D) Correlation between NLDev and heterosis in all hybrids (n = 447), both relative to MPH (light blue) and BPH (dark blue). Red dashed lines represent zero axes. Black dashed line represents 1:1 line. Grey dots are all hybrid individuals. r2 are Pearson’s coefficients of correlation (***P < 0.001). BPH, best-parent heterosis; MPH, mid-parent heterosis; NLDev, nonlinear deviation; NS, nonsignificant.

