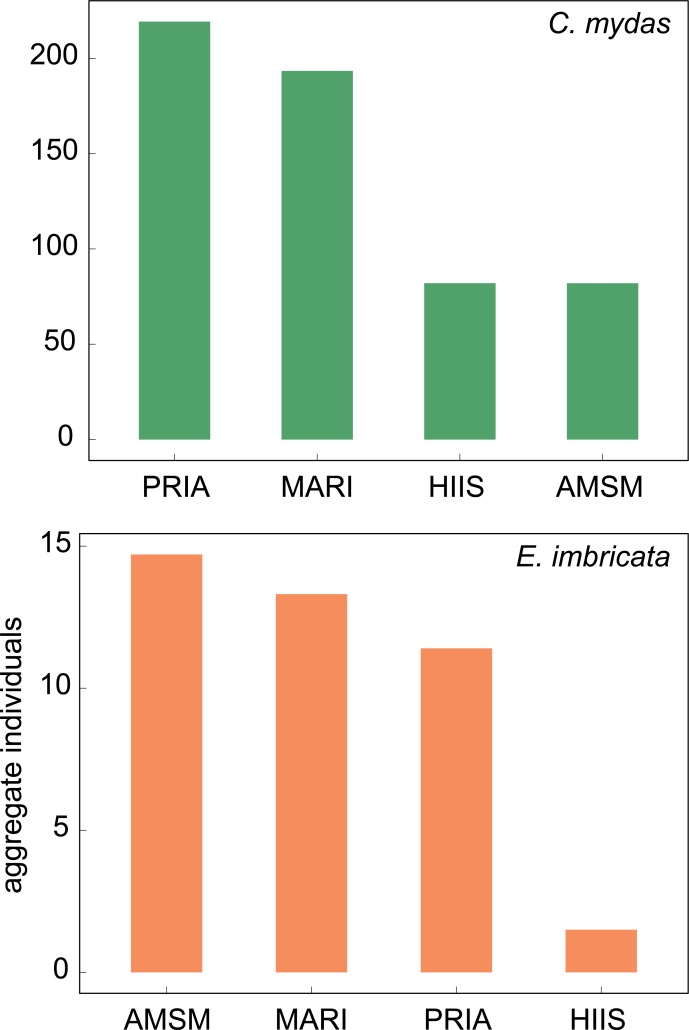
Fig 3. Predicted number of individual turtles detected in surveys varied by species and region.
Density models predicted > 14 times as many green turtles (576) as hawksbills (41) predicted across all regions: the Pacific Remote Island Areas (PRIA), American Samoa (AMSM), the Mariana Archipelago (MARI), and the Hawaiian Archipelago (HIIS). PRIA had the greatest number of green turtles (219), followed by MARI (193), HIIS (82), and AMSM (82). While densities were far greater for PRIA than MARI, number of green turtles were similar. For hawksbills, AMSM had the greatest number (15), followed by MARI (13), PRIA (11) and HIIS (2). Higher abundance of detected green turtles in the PRIA and hawksbills in AMSM occurred despite the relatively few number of sites surveyed for each of these regions. Correspondingly, HIIS showed low numbers despite more sites, substantially larger available habitat area, and a greater total survey distance than all other regions (HIIS: 772, MARI: 364, PRIA: 286, AMSM: 257 km). We multiplied densities per site (Fig 2) by average number of tow segments per annual survey to calculate predicted individuals per site, then summed all site values for each region for aggregate predicted individuals. Green turtles are shown in green, and hawksbills in orange.

