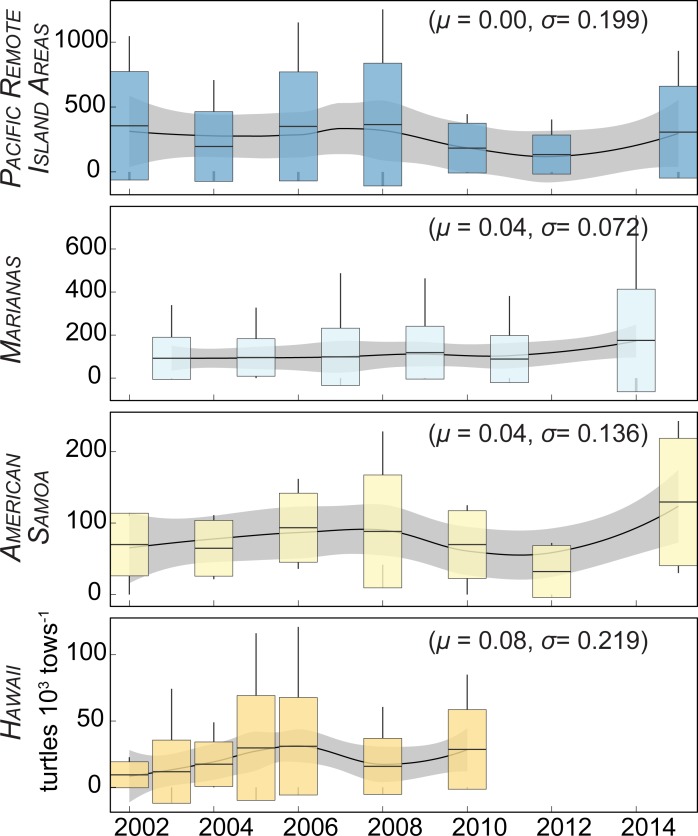
Fig 4. From 2002–2015, regional green turtle densities were stable or increased.
Box plots (mean, 1 sd, min-max) show fitted density estimates for sites in each region, by year. All regions show growth from 2002–2008, declines from 2008–2012, and growth thereafter. From these times series, stochastic exponential growth models calculate rates of change. We list the fitted parameters. Population growth rate was inversely correlated with population size, which though not unexpected, may indicate density dependence. Black line is a LOESS model with standard error (gray band).

