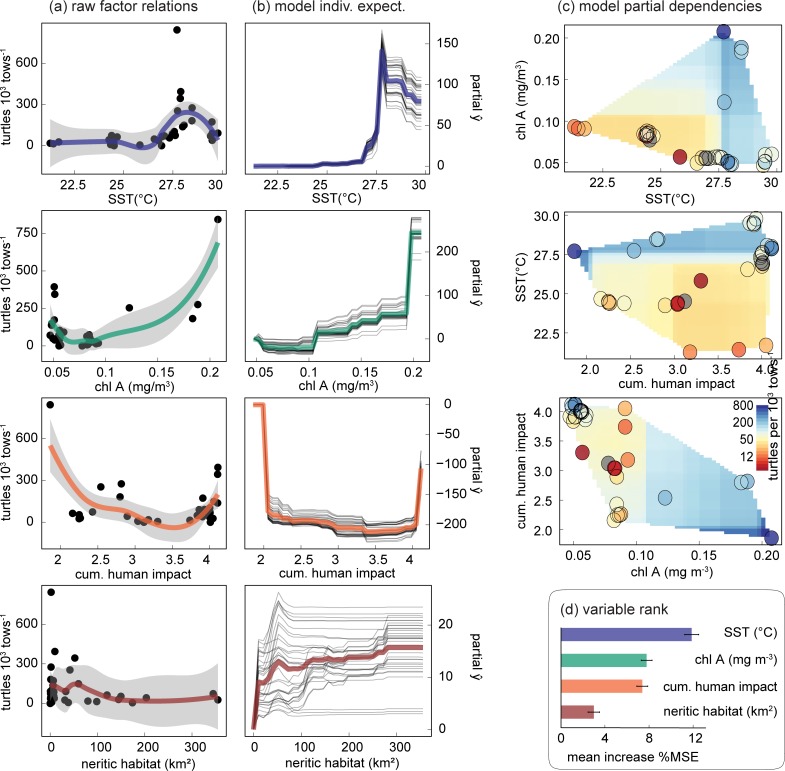
Fig 5. SST and productivity are the highest-ranked drivers of sea turtle densities.
We used RF models to assess how SST, ecosystem productivity, available habitat, and human impacts affected sea turtle densities. (A) Scatter plots of single factors reflect expected relationships. Densities show a thermal envelope peaking at 27.5°C, increase with ecosystem productivity, decrease with an index of human impact, and surprisingly show little effect from habitat area. Filled circles are site densities, colored lines are LOESS fits (gray bands are standard error). Results from the RF model formalize these relationships in (B) ICE plots and (C) two variable PDPs. Shaded polygons represent the predictor space, while filled circles show the observed density values. The modeled habitat-density effect now appears positive, but noisy. Partial ŷ values assess the average change in the predicted value from each model factor, thin gray lines represent each site, and colored lines are the mean relationship. For some sites, (C) the negative influence of human impacts to turtle density appears mitigated by optimal SST. (D) Model variables are ranked according to the percent increase in MSE of removing each variable. The average was taken across each iteration of a LOOCV. Historical overexploitation, conservation efforts, and spatial population structure likely contribute to the unexplained error, and quantifying these factors may improve model performance.

